

In this article we provide a technical exploration of the potential of artificial intelligence for large-scale analysis of satellite data to detect the destruction of human settlements, with a case study on Sudan’s Darfur region.
We would like to say a special thanks to all those who contributed to this work, including Milena Marin, Micah Farfour, Julien Cornebise, Daniel Worrall, Laure Delisle, Alex Kuefler, Denis Kochetkov, Alfredo Kalaitzis, Buffy Price, Sherif Elsayed-Ali, Tom Jones, and Maral Bayaraa. Imagery for the project was provided through Maxar’s GBDX service an in-kind contribution by The Satellite Applications Catapult.
Armed conflict between the government of Sudan and opposition groups has plagued Darfur since 2003. The conflict has been characterized by a high level of violence directed against hundreds of thousands of civilians, including killings, torture, enforced disappearances, destruction of villages, rape, pillag and forced displacement. The atrocities were so severe that the International Criminal Court issued two arrest warrants for then-President Omar al-Bashir, for war crimes, crimes against humanity and genocide. Since the beginning of the conflict, numerous Amnesty reports and campaigns have exposed grave human rights violations and called for justice and protection for the people of Darfur.
In 2016, Amnesty researchers shed new light on this forgotten conflict, documenting another wave of violence with countless villages attacked and destroyed by the Sudanese government and its allied militias. To understand the true scale of the destruction, Amnesty then launched Decode Darfur and Decode the Difference, calling upon thousands of digital volunteers to scan the vast territory of Darfur and identify destroyed villages.
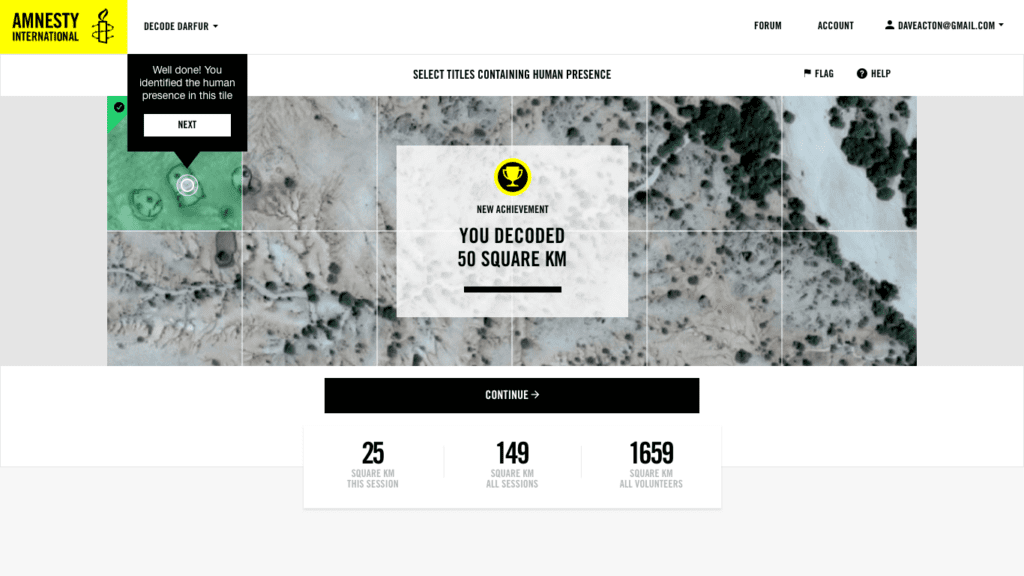
Using micro-tasking technology – a type of crowdsourcing method – Amnesty enrolled digital volunteers to scan through satellite imagery to identify remote villages in Darfur and determine if these had been damaged or destroyed between 2014 and 2016. In a short period of time, 28,600 digital volunteers joined the project from 147 countries. Collectively, they generated 13 million annotations covering 2.6 million satellite tiles of approximately 100×100 metres each.
Achieving scale: from researchers to crowdsourcing and machine learning
Amnesty’s goal was to scale up the Darfur research. The first step was engaging thousands of digital volunteers through the Decode Darfur and Decode the Difference projects, allowing us to map an area of over 300,000 km2. While impressive, this was far from covering the whole of Darfur over time, which we needed to do to highlight various waves of destruction. To scale up the work further, we turned to artificial intelligence (AI).
Before sharing the data with partners and engineers, Amnesty International developed a risk assessment model based on the following criteria:
- Sensitivity and graphic nature of the data – while some levels of graphic content can be used with proper mitigation strategies, content like sexual violence, killings, torture or incidents involving children is never suitable for wide sharing with partners or digital volunteers and needs to be handled only by trained reseachers.
- Transparency – a human rights risk assessment is conducted to determine whether the crowdsourced data can be shared. The data can be anywhere from private to shared with vetted partners to fully open based on the risks.
- Data validation – planning for valid data is critical to the success of a project. Key considerations for data validity include: a well designed project with clear instructions; continuous engagement of volunteers making sure their questions are answered; redundancy in the data (ensuring each image is labeled by multiple volunteers); expert contributions; analysis of the accuracy of each labeller relative to their peers and the experts; statistical analysis to determine the validity of the data.
- Risks of malicious attacks and misuse of data – large-scale monitoring projects can become targets of malicious actors, e.g., the map with destroyed/intact villages could be incredibly harmful in the wrong hands.
Working with machine learning researchers Julien Cornebise, Honorary Associate Professor at University College London (UCL), and Daniel Worrall, then a PhD student at UCL, Amnesty used the large dataset of annotated chips of satellite imagery resulting from Decode Darfur and Decode the Difference to train a machine learning model to automatically map vast desert areas. The model was able to identify “human presence,” as well as “destroyed” and “mixed” (i.e., partially destroyed) villages, at a country-wide scale, covering 500,000 square kilometres. With the results embedded in a web-based mapping app, our human rights researchers were able to refine the annotations and visualize at scale the patterns of habitation and the destruction. The power of these methods was made apparent when the same models, without retraining, gave coherent results when applied thousands of kilometres south, at the border between South Sudan and Uganda, a region with markedly different terrain and vegetation.
The main limitations included a small team with limited resources, a reliance on a mosaic of archival images that we stitched together, and the fact that some tiles dated back more than a decade. We needed to find a way to source data more sustainably and keep improving the performance of the model.
In 2018 one of the original authors then joined Element AI, a global developer of AI software. This provided a great opportunity to move past experimental research, have a dedicated team of engineers, explore partnerships to source up-to-date imagery, and investigate new research directions such as super-resolution of free imagery.
Collaboration with Element AI
The machine learning work continued through an ongoing collaboration between Amnesty and Element AI, with whom we previously worked on a report exposing the scale of online violence against women on Twitter in 2018.
In 2019, we jointly published a white paper on AI-enabled human rights monitoring, which detailed the potential of using computer vision and earth observation data for large-scale human rights monitoring, among other use cases.The Darfur project described here put that approach into practice. By reusing the crowdsourced analysis, and following the same image classification approach applied by Julien Cornebise and Daniel Worrall, our goal was to develop a robust quantitative analysis of the destruction of human settlements in Darfur.
The methodology
Through Element AI’s collaboration with the Satellite Applications Catapults’ ML Use Case Programme, we were able to access Maxar’s high resolution commercial data via its GBDX platform, provided as an in-kind contribution. This data allowed the Element AI team to assess the viability of training deep learning models for detecting destroyed villages in Darfur.
Equipped with this dataset of images (“tiles” extracted from the Maxar satellite imagery) and the crowd-sourced annotations (“labels”), indicating whether a human settlement is visible in the tile – and if so, whether it’s destroyed – our aim was to learn the task of mapping an image to the correct label. In other words, given an unseen tile, we wanted to accurately predict whether a human annotator would mark that tile as a destroyed village.
Convolutional neural networks (CNN) represent the state of the art for image processing and classification. A typical approach when labelled data is scarce is to take an off-the-shelf model pre-trained on a different task, and fine-tune it to adapt it for another task. We experimented with a number of CNN-based approaches for solving this classification task, which are all based on the ResNet50 architecture, pretrained on a completely different, 1,000-class image classification dataset known as ImageNet.
All ResNet50-derived models vary with respect to the channels (red, green, blue) of the image considered by the model, the fine-tuning vs freezing of the pre-trained weights of the ResNet50 model, the number of layers of the pre-trained ResNet50 model to re-use, and data augmentations, a method to artificially increase the dataset volume and improve model performance.
Out of 40 ResNet variants, the one with three-channel input, fine-tuning, full depth, and augmenting with rotations and flips performed the best on our validation dataset.
Binary vs. multi-label classification
In the binary classification scenario (destruction, no destruction) for every tile, Element AI’s model produces a probability that the tile contains destroyed buildings.
However, the presence of a human settlement in a tile correlates with the presence of destruction – without buildings in an area, there can be no destroyed buildings. Therefore we questioned whether a simple binary classifier would truly learn to discriminate destroyed buildings from intact ones, or if it would simply learn to discriminate uninhabited regions from ones with human presence.
In the multi-label classification condition, our model produces three probabilities: the probability that nothing is in the tile, the probability that intact buildings are in a tile, and the probability that destroyed buildings are in the tile. These three probabilities are all computed separately. For instance, the model might learn to say that there’s a 72% chance of intact buildings, and a 64% chance of destroyed buildings, but because these events are not mutually exclusive the sum of all classes need not add up to 100%.
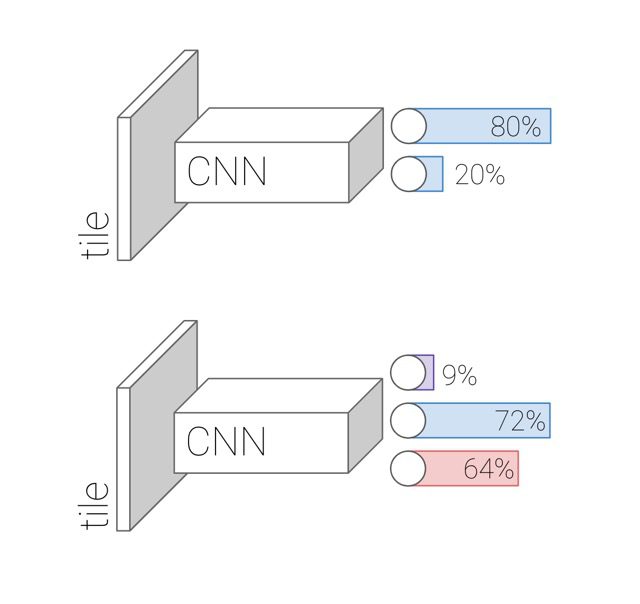
Figure 3: Architecture of the binary (destruction or no destruction) and multi-label (nothing, human presence, destruction) classifiers. The numbers in this figure are for illustration only.
Results
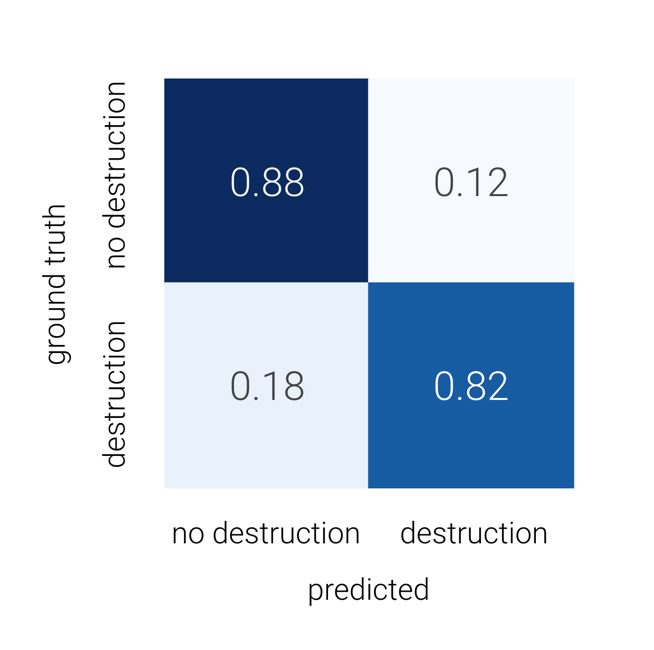
Classification tasks are normally assessed using accuracy metrics called Precision, Recall and F1 score, and the performance can be summarized with a confusion matrix. Precision is higher when a tile predicted by the model as destroyed is actually destroyed. In other words, precision asks, with regard to the tiles predicted as having been destroyed, what percentage were destroyed according to the ground-truth (the objective fact on the ground, or in this case the tiles annotated by human experts)? Recall, on the other hand, asks with regard to the tiles that were destroyed according to the ground-truth, what percentage did the model successfully predict as having been destroyed? The F1 score combines Precision and Recall. A confusion matrix is a 2×2 table for comparing predictions to the ground-truth.
We computed a confusion matrix over the held-out, labeled test dataset, shown in the figure below for the “destruction” class. Of the tiles featuring destroyed buildings, the multi-label classification model was correct 82% of the time. Of those featuring no destruction, the model was correct 88% of the time. False negatives were more prevalent than false positives.
For a decision threshold chosen to maximize the F1-score on a validation set, the multi-label classifier achieved 91% precision and 85% recall. On the testing set, precision was 85% and recall was 81%.
There exists a tradeoff between precision and recall. If the goal is to find all the destruction locations and we are willing to bring enough human effort in the loop, we should shift the threshold towards improving recall. A high-recall model would be able to select almost all positive examples of destruction, but with it would surface more false examples. Human annotators are brought into the loop as a follow-up step to manually filter out those false positives. If, on the other hand, our goal isn’t finding all the destruction and we don’t want to generate too many “false alert” tiles to be checked by human experts, we should choose a threshold that improves precision instead.
Based on the metrics on the test dataset in multi-label classification, we can summarize the performance as follows: the model successfully found 81% of the tiles that were recognized by human experts to contain destroyed buildings. Of all tiles that the model predicts to contain destruction, 85% had been recognized as real destruction by human experts.
Satellite imagery data pipeline
One of the most significant achievements of the project was its data processing pipeline.
We learned how to curate datasets from different satellite imagery platforms, and also what an efficient data pipeline looks like. A lot of handy in-house tooling was built for this project, which can be reused in similar satellite imagery projects.
Sentinel-2 images from ESA
The European Space Agency makes 10m resolution Sentinel-2 images publicly available on cloud platforms, such as Amazon AWS and Google Cloud Platform. Normally, a raw Sentinel-2 image covers a much larger area than the area of interest (AOI). Thus we built a data processing pipeline to extract only the areas that we need. We created a dataset consisting of multiple images of the same location over time (see Figure 5)
Figure 5: Sentinel-2 images of a single location captured at different times.
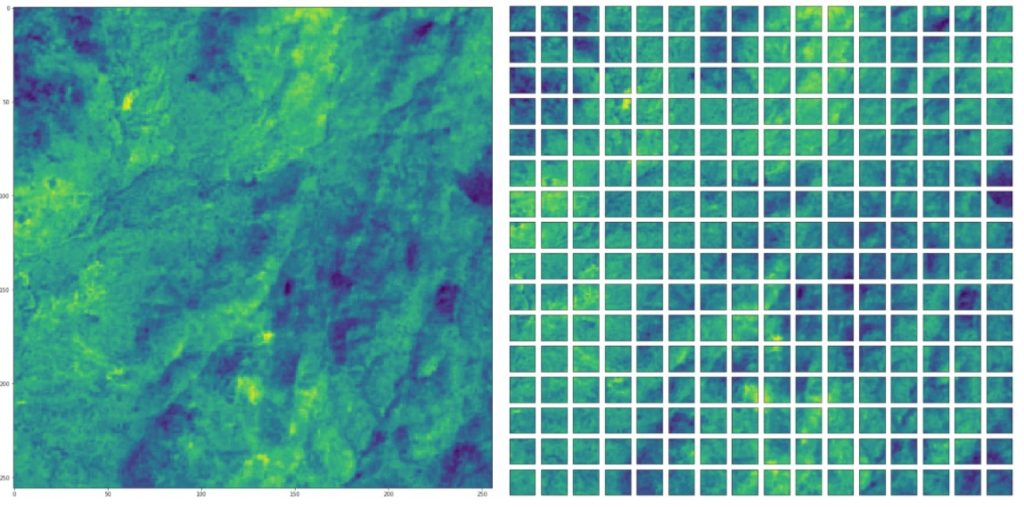
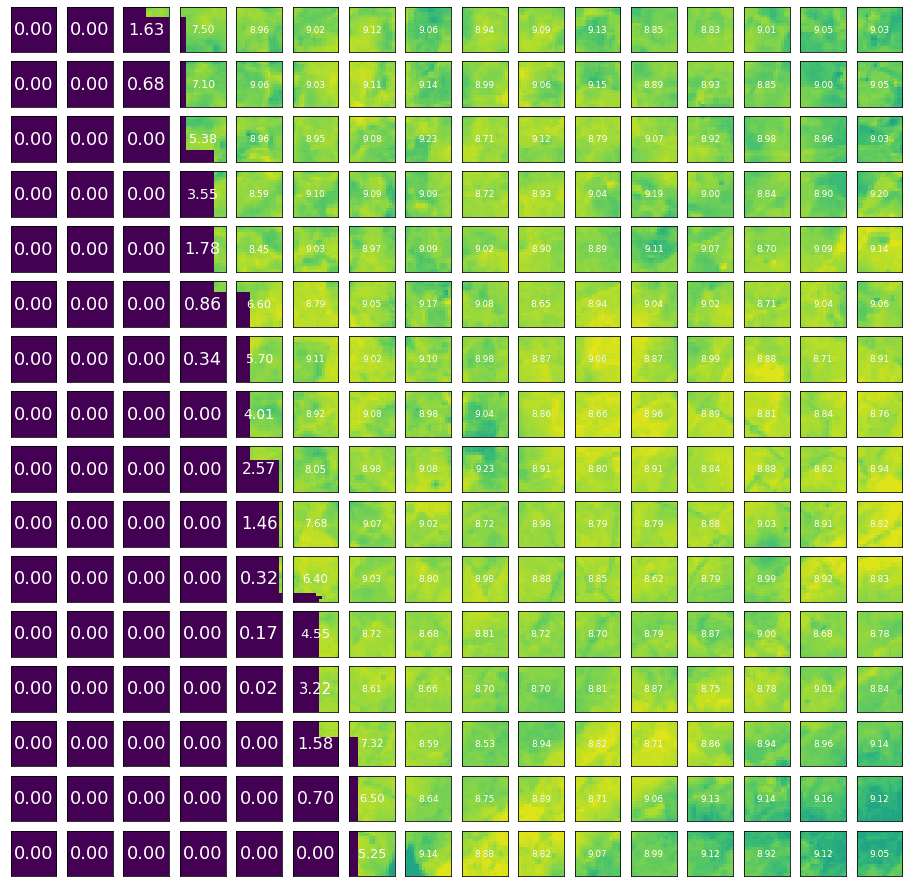
It is common for parts of a large satellite image to be blank. If we were to exclude those images, we would be left with too few images to train our models with. In our pipeline, we divided the images into the required (smaller) size, or “chips.” By computing the Shannon entropy in a chip, we identified those that were completely or partially blank. (Entropy is a concept from information theory; it measures the amount of information in the data. Hence, low entropy indicates blank sections). After splitting a large tile into chips, we filtered out the chips with relatively low entropy (see Figure 7)
WorldView-2 and GeoEye images from GBDX
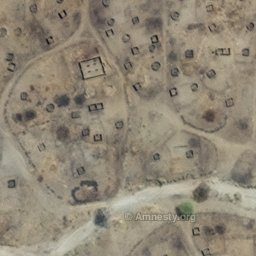
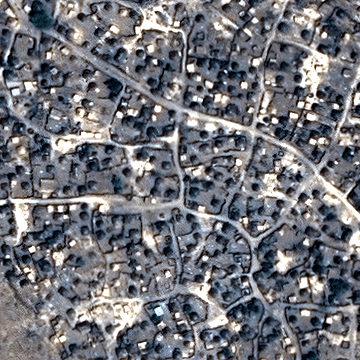
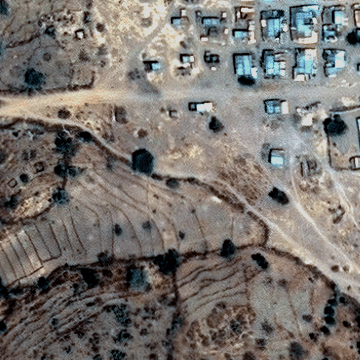
Maxar’s GBDX platform provides a rich functionality to process images and download only the parts that we need. Compared to Sentinel-2, the GBDX platform is designed to better meet the demands of modern machine learning tasks. However, to leverage Element AI’s internal GPU cluster, our data needed to persist outside of the GBDX platform. Therefore, we built a utility tool to ease the selection and download process from the GBDX platform. Here are some tiles we downloaded from the GBDX platform.
Visualization on web map
To visualize the predictions, we built a web app that superimposes the probability of human presence / destruction on an image.
Challenges in preparing the image dataset
High resolution imagery access
One of the biggest obstacles for machine learning satellite imagery projects in general is financial. Access to high resolution satellite imagery is expensive, especially when analyzing a large area. It would cost about several million US dollars to download high resolution images for the entire Darfur region a single time. Furthermore, satellite imagery is often not available over remote areas such as Darfur and to regularly “task” fresh imagery for the full extent of Darfur at high resolutions would make any technical approach economically infeasible.
We can try to mitigate this by working with partners such as Satellite Applications Catapult to determine the cost-effectiveness of strategies like exploiting different image characteristics or narrowing down the area we want to analyze. However, establishing a sustainable model for data access for this type of routine monitoring application continues to be a massive challenge, especially for non-profit organizations.
Super-resolution
Low-resolution images are widely available and free to use. Super-resolution is the process of upscaling and / or improving the details within an image. If we could super-resolve low-resolution images, and thus reduce our dependence on high-resolution images, then the cost of continual monitoring for atrocities would be lessened.
Element AI studied the super-resolution problem separately and successfully developed a multi-frame super-resolution algorithm, called HighRes-net. HighRes-net takes multiple low-resolution images from the same location over time and uses the subpixel shift between these images to output a super-resolved image. It is done in a supervised manner; the ground-truth here is a high-resolution image of the same location. We tested this methodology on detecting human presence by collecting multiple Sentinel-2 images of the same location. We faced several difficulties during the experiments.
- Our human settlement labels were from the first Decode Darfur project and were made on zoom level 18 map tiles, which corresponds to 0.6 metres per pixel. The Sentinel-2 image resolution is 10 metres per pixel. In a high-resolution Maxar image, a 10m2 area comprising 278 pixels corresponds to one pixel in the Sentinel-2 image!
- The original HighRes-net work achieved a 3x factor of super-resolution and it was proven on the two sensors (with resolutions of 100m and 300m) onboard the PROBA-V satellite. If we pair Sentinel-2 images with high-resolution images from GBDX, e.g., 2m resolution in non-pan sharpened WorldView2 image, the upscaling factor would be x5. Images from different satellites are also geospatially misaligned, which further degrades the performance of a pretrained HighRes-net.
Due to limited time and staff, additional work would be needed to modify the architecture of HighRes-net for this application and to train it from scratch.
Destruction classification
To detect destruction, we curated a new dataset using Maxar’s GBDX platform. The data came from Satellite WorldView 2 and GeoEye, with ~0.5 m/pixel resolution. In the first projects, only labels from experts are used in the final dataset, across four categories: 1) Nothing; 2) Only human presence; 3) Only destruction; and, finally, 4) Both destruction and human presence. The timestamp of the images is missing and we only had a rough estimate of the time range (from 2014 to 2016) for when the destruction took place.
This means that we expected the old labels to be unreliable on a new dataset. We downloaded multiple timestamps of high resolution images within the time range and randomly selected a subset of them for relabeling. After this sanity check, we recognized the labels were still very reliable after all. This may be due to the fact that only a few images from Darfur are available on the platform.
Conclusions
We have trained and evaluated a state-of-the-art computer vision model (ResNet50) fine-tuned to spot patterns of destruction in parts of the Darfur region. The best model on the test data shows higher precision (85%) than recall (82%). This means that a system deployed in the general Darfur area would successfully identify 82% of all destruction cases (and miss 18% of them), while only 15% of the destruction “alerts” would be false positives. These metrics indicate that the deployed model could thereby save significant time and operational costs for intelligence research.
Future work
Given additional time and resources, we would develop our findings further with the following:
Run larger-scale experiments
There is randomness in the neural network training process; doing larger-scale experiments on the same dataset would increase confidence in the performance of our technique.
Multiframe super resolution
The application of multiframe super resolution was not studied thoroughly. In the future we should train HighRes-net from scratch on paired low- and high-resolution images of the same location. It should also be noted that we need to qualitatively assess the extent to which super resolution could provide budget savings.
Geographical coherence
A whole village does not usually fit into only one 360 x 360 tile of high resolution image. The fact that destruction tends to encompass the entirety of a village points towards further study needed to quantifiably assess whether the tiles of destruction are geographically coherent, i.e., whether destroyed tiles tend to cluster. Our demo app visually confirms this (see, for instance Figure 9), but more evidence is needed. Should the hypothesis be true, it could be used as an additional signal to aid a human-in-the-loop.
Final considerations and lessons learned
After this experiment, large scale human rights research and continuous monitoring of conflicts aided by artificial intelligence feels within reach. But numerous challenges persist and organizations like Amnesty International are not yet able to include such tools in their research toolbox:
- Human rights organizations themselves need to carefully evaluate the risks of such research against potential benefits – if effective mitigation strategies cannot be put in place, organizations need to be comfortable with dropping projects altogether.
- Training data for human rights AI algorithms is not easily available and data collection processes are not straightforward. Amnesty worked with its already-strong volunteer base to generate such data and in the future, a combination of volunteer-driven analysis and AI can be used where AI can supply functionality at scale, whereas the volunteers provide depth.
- Such projects require a large constellation of partnerships and pro-bono or heavily subsidized collaborations. Amnesty’s technical partnership with Element AI was meaningful and deep – both organizations allocated dedicated teams for the project where machine learning engineers worked hand in hand with Amnesty researchers over a long period of time. Through the partnership with the Satellite Applications Catapult we had access to much-needed satellite images but continuous access to operationally useful satellite imagery is still not a reality.
- Finally, the accuracy of such algorithms needs to be carefully considered. Human rights researchers need technical literacy to understand and interpret the data and to make crucial design choices such as calibration of accuracy metrics such as precision and recall.
_______________________________________________________________________
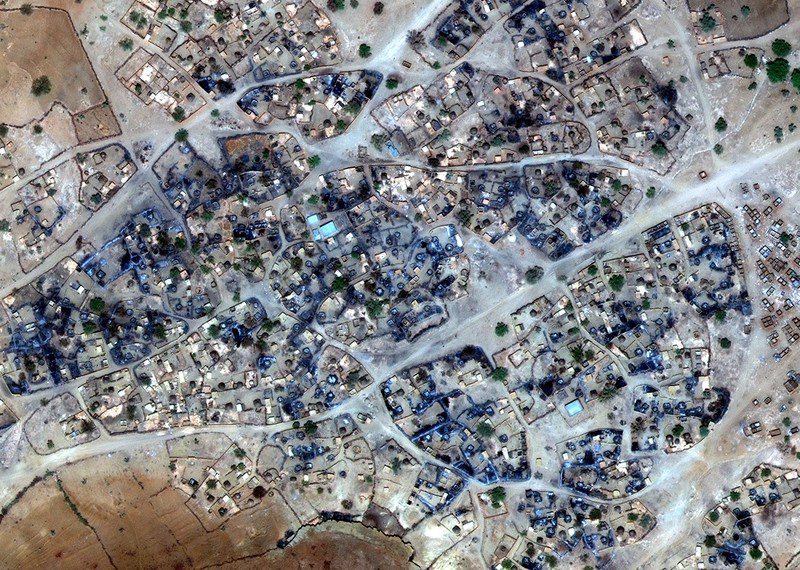
Header image: The village of Bourgu, Darfur, after an attack. The image was taken on 8 April 2016. Satellite image ©2020 Maxar Technologies
Milena Marin is a Senior Advisor with Amnesty’s Evidence Lab. She has over ten years’ experience working at the intersection of technology, data and social good on issues like human rights, public sector transparency, anti-corruption and open data.She leads Amnesty Decoders, an innovative platform using data science, crowdsourcing and artificial intelligence to process and analyse large volumes of data such as documents, satellite images and pictures for human rights research.
Freddie Kalaitzis is a Machine Learning and Project Lead at the Frontier Development Lab US research accelerator, funded by NASA. Until recently he was an Applied Research Scientist at Element AI in London, focusing on applications of ML and statistics that enable NGOs and nonprofits. He led the Super-Resolution research collaboration with Mila (Yoshua Bengio’s lab), and was awarded by ESA for topping the PROBA-V Super-Resolution challenge. He is a primary co-author of the first technical report written with Amnesty International, on the large-scale study of online abuse against women on Twitter.
Buffy Price is Partnerships Manager, AI for Climate, at Element AI, which brings Element AI’s deep expertise in machine learning to to support private and public sector efforts to solve the climate crisis. Prior to Element AI, she spent 7 years as a Senior Advisor at Amnesty International, providing strategic advice and support to Senior Management on development initiatives to enable Amnesty to adapt and respond to emerging trends and issues.