
This article is based on a talk given at the 2018 International Journalism Festival “On big data, small tasks and massive audience engagement”
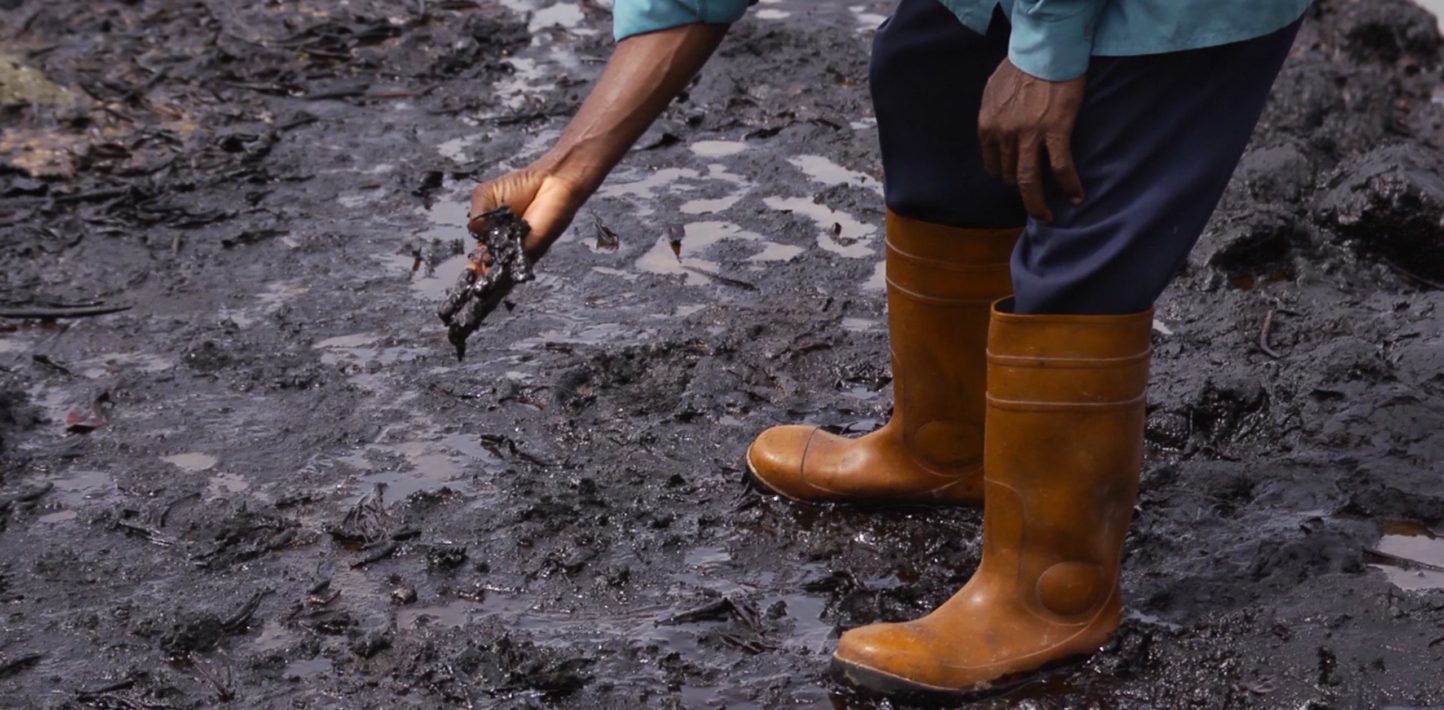
Nigeria’s Niger Delta is Africa’s most important oil-producing region. It is also one of the most polluted places on Earth. For decades oil spills have been damaging the environment and devastating lives in this part of the continent’s most populous country.
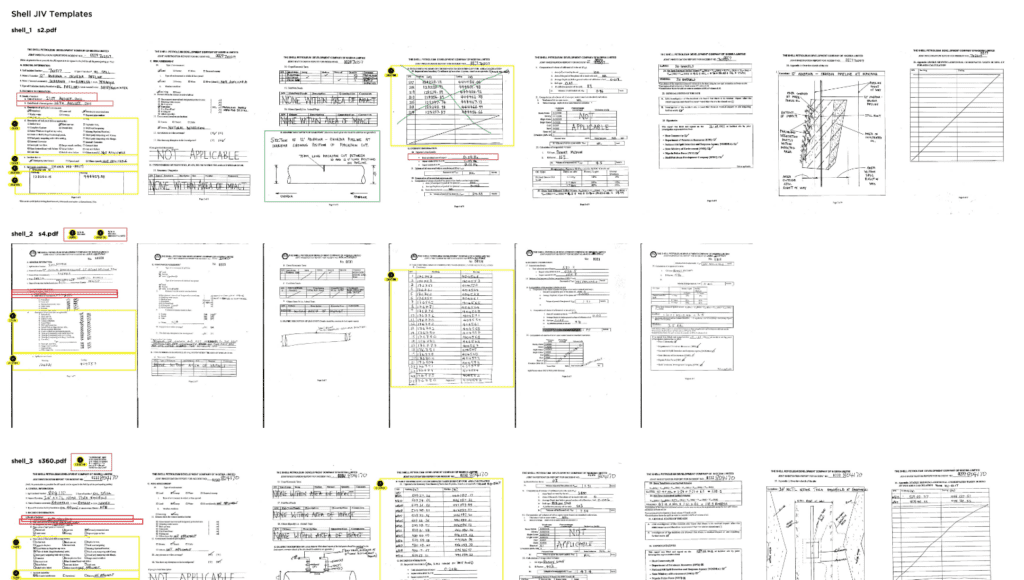
Some of the oil companies working in the Niger Delta publish investigative reports and photographs of oil spills. Still, most of the information that would allow organizations like Amnesty International to probe the credibility of this evidence is ‘trapped’ in handwritten and scanned documents.
To transform thousands of documents and photographs into structured data, we enlisted digital activists with our Decode Oil Spills project and used micro-tasking to channel their efforts. In total, 3,500 people from 142 countries took part in this project. They answered more than 163,000 individual questions and worked over 1,300 hours, the equivalent of one person working full-time for eight months. Amnesty’s decoders analyzed thousands of documents and photographs, helping to create the first independent, structured databases of oil spills in the Niger Delta, covering a time frame from January 2011 to December 2017.
In total, 3,500 people from 142 countries took part in this project. They answered more than 163,000 individual questions and worked over 1,300 hours, the equivalent of one person working full-time for eight months.
Below you can find a step-by-step guide to how we did this:
Step 1: Define the task and methodology
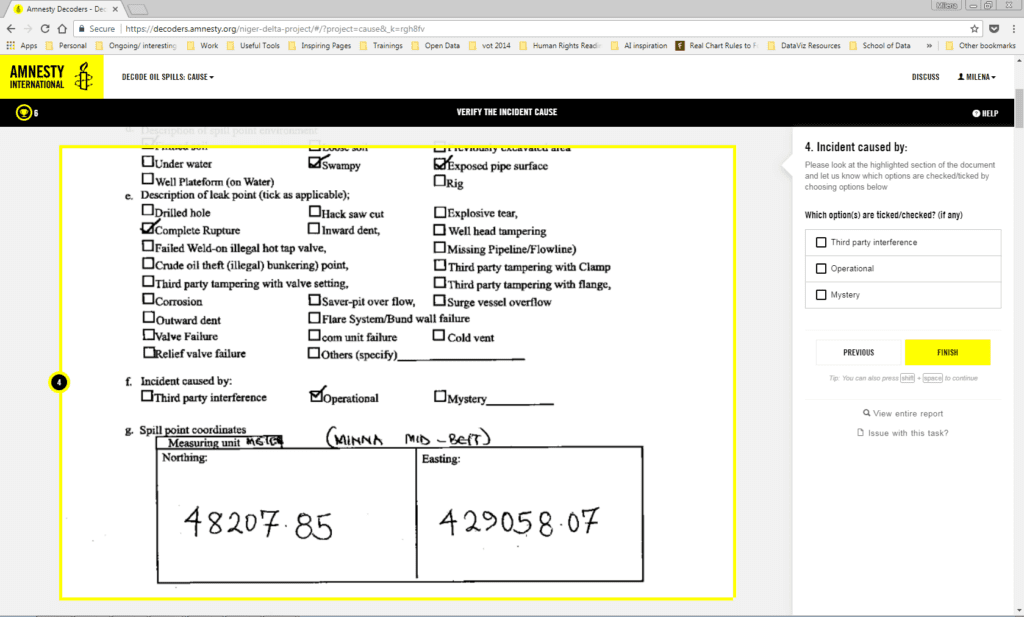
The first step was to work with our researchers to define a task for our digital volunteers or ‘decoders’. The main goal was to extract structured information from documents and photographs relating to oil spills that have been made public by two of the largest companies operating in the Niger Delta: Shell and Eni. But these documents were an average of eight pages long and extremely rich in detail. We had to narrow down our research questions to make sure we collected the relevant data needed for our goal of holding Shell and Eni to account while creating “micro-tasks” that were doable in a short time by people with limited training. After numerous workshops, we narrowed down the tasks to extracting the cause, location, and size of spills from the documents. We also wanted decoders to corroborate the information provided by the corporations with images taken at the spill.
Step 2: Get data, archive and pre-process
The next step was to gather all the available data, including tables, documents and photographs. Before scraping the companies’ sites, we had to check their terms of use and get legal advice to make sure we could use the documents as we intended. While processing the data, we found that there were huge inconsistencies in the data collection forms used by the companies, and we had to find ways to mitigate these issues.
Step 3: Design and develop
To engage thousands of people, we had to focus on developing a tool that had both an extremely user-friendly interface and a reliable database to collect all the contributions. Our technical partners at Focal Labs help build the interface using open source tools such as Hive, a modular, flexible, open-source platform developed by the New York Times and Discourse, an open-source discussion platform.
Step 4: Engage volunteers
We worked with campaigns and communications specialists on an engagement strategy which included media work, email campaigns, social media outreach and offline events organized by Amnesty sections.

To estimate the decoders’ rate of activity, we used a basic engagement model: 90-9-1%. In other words, we assumed that 90% of the volunteers would review between two and five documents, 9% would engage with an average of 20-40 documents, and 1% of the volunteers would become what we called “superusers,” reviewing hundreds of documents and also helping others in the community. To engage the superusers and to ensure we answered their questions, we also created a community forum where decoders could speak directly with the Amnesty team.
Step 5: Verify, analyze, publish
The primary verification mechanism of micro-tasking is ensuring that multiple decoders complete each task – the exact number varies from project to project and is determined in a testing phase. To verify the data, we checked for agreement among all the decoders who completed a task, and also checked if they agreed with Amnesty researchers participating in the project. In Decode Oil Spills, we also consulted external pipeline experts to corroborate our findings.
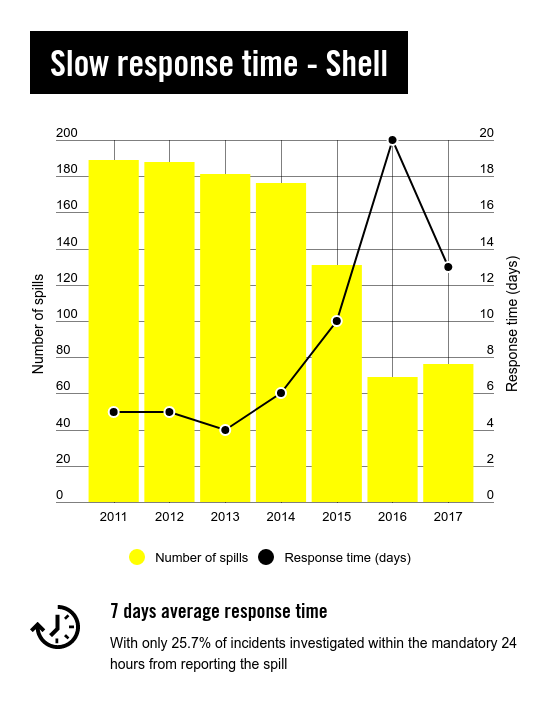
The result of this entire investigation was a wealth of evidence pointing to negligence by Shell and Eni. Decoders identified at least 89 spills where there was a good reason to doubt the oil companies’ claims about the cause. For example, in cases where the companies alleged theft had led to oil spills, decoders highlighted photos showing apparent corrosion on the pipes. The latter puts the onus on the companies to resolve the issue and compensate local communities for damage. If confirmed, this could mean that dozens of affected communities have not received the compensation that they deserve.