Rumours of possible voter intimidation and potential protest were rife ahead of the U.S. Presidential Election on 3 November, 2020. In response, Amnesty International Berkeley Digital Verification Corps (DVC) began preparations to carry out real-time open source monitoring of social media during the elections — a massive undertaking that required planning, coordination, and a thoroughly considered methodology.
One week before voters went to the polls, our team began making plans to monitor social media and collect information related to any instances of excessive use of force, police failure to protect, or voter intimidation for our partners at Amnesty International. At the final count, our team of more than 60 students collected over 900 pieces of content on election day and in the days that followed. This monitoring effort was a collaboration between the DVC, the Human Rights Center (HRC), and the Berkeley School of Journalism. This project was informed by a similar project from June 2020, where the Berkeley and Cambridge University DVCs helped Amnesty discover, verify, and monitor instances of excessive use of force against protestors during the U.S.-wide Black Lives Matter protests. We adapted and expanded that project’s methodology to allow us to carefully monitor the US elections. Here, we outline five of the most important lessons we learned.
1. Organize and Standardize Methodologies in Advance
When it came to collecting content, we as managers of the Berkeley DVC prioritized the ‘asks’ from Amnesty, who provided us with broad categories of human rights violations to consider. We then further refined these categories into a series of standardized fields for recording the occurrence and nature of human rights violations. This would include identifying the actors present and activity observed, allowing for the collection of standardized data on the types of events taking place and their relevance within a human rights context.
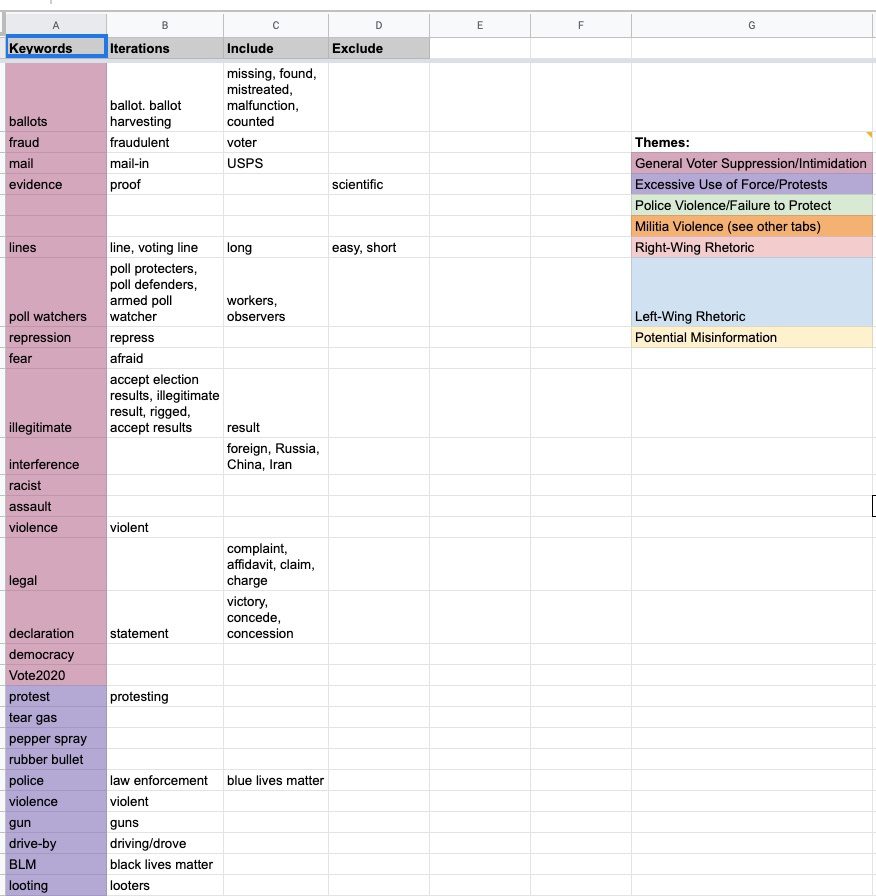
Our leadership team took charge of structuring and organizing our methodologies beforehand. For this, we split into two teams: one responsible for search terms and the other for spreadsheets. The search terms team brainstormed over 100 keywords, which were then refined through several iterations into lists of words to include and exclude in our searches. We then separated the terms into categories based on our research questions. For example, an obvious term was “ballot”, seen in column A. Its iterations should include common misspellings or pluralized versions of the word — in this case, our only iteration was “ballots”, seen in column B. Since we were interested in voter intimidation or suppression, our words to include in column C were “missing”, “fraud”, “mistreated”, “malfunction”, and “counted”. This term didn’t require any obvious exclusions, but for a term like “Hawaiian shirts” — often worn by the ‘Boogaloo Bois’, a far-right and anti-government group — we excluded words like “vacation” and “beach”, which would likely have given us extraneous or erroneous results. Once we had exhausted iterations, inclusions, and exclusions, we filed the terms under different categories that matched our research questions. “Ballot” was in the General Voter Suppression/Intimidation category, while terms like “tear gas” and “rubber bullets” were categorized under Excessive Use of Force. These search terms provided a foundation for our team members to build TweetDeck columns for monitoring, and allowed us to shift locations with ease by simply adding location names, such as “Washington D.C.” or “Maricopa County” to our searches. This list of search terms expanded throughout the project as we discovered new trends, but the original keyword brainstorming was an invaluable launching point.
Our master spreadsheet — where investigators entered their findings — allowed for categorization of content and standardization of data entry. We included two types of columns: a “checkbox” column to filter videos based on what was depicted in them (e.g. does the video depict a protest?), and a dropdown menu to provide additional details about the content (e.g. were the protesters violent?). We standardized the dropdown menu options for clarity, and gave researchers the ability to select more than one option using open source code from this website and Google Script Editor.
In addition to categorizing the data, we wanted to be able to separate our findings visually to make them easier to sort based on the broader categories. To do this, we used the IMPORTRANGE() Google Sheets function, importing the whole sheet into multiple tabs on a new “Editorial” sheet. We then filtered (using the Google Sheets filter function) within each tab using the checkbox columns. This allowed us to have a tab for protests, a tab for disinformation, a tab for police violence, and so on. This also allowed us to filter and find combinations of event characteristics; for example, by marking the “protest” and “violence” checkbox, it was possible to distinguish between violent and nonviolent protests.
2. Embrace the Virtual Format
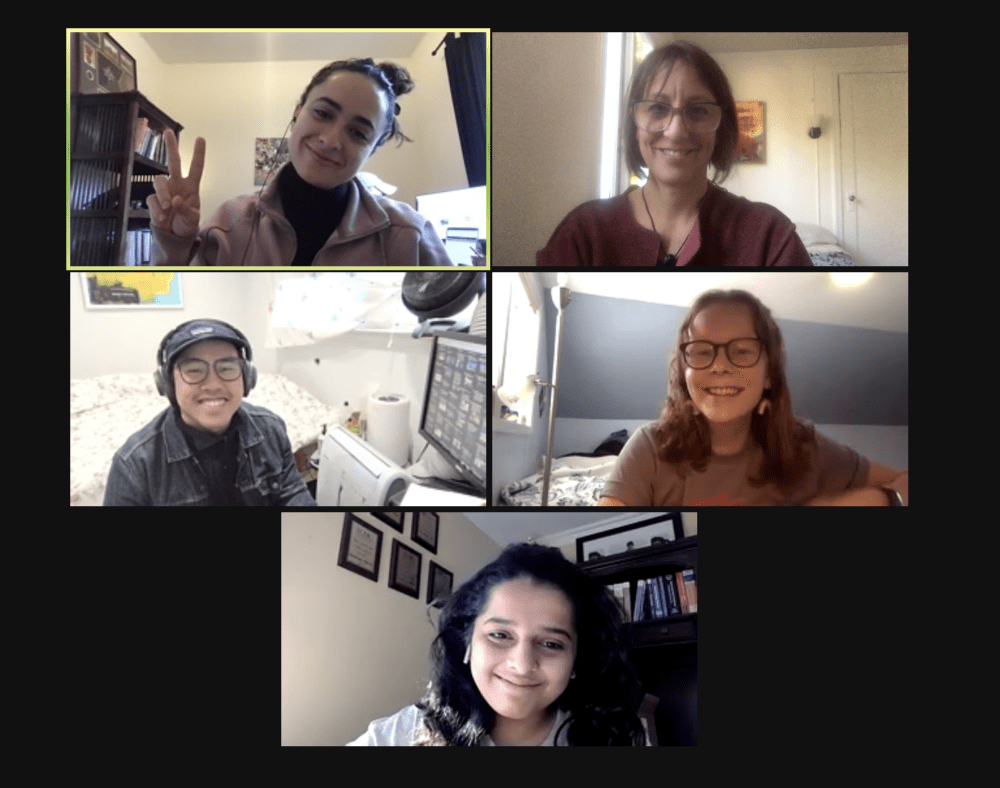
Undertaking a monitoring effort of this scale would be challenging under the best of circumstances; the COVID-19 pandemic presented the additional challenges of remote working. It is impossible to fully replicate the vibrancy of a communal work space — the constant chatter, small talk, sharing of food and laughter — in an online meeting. Technical issues, including ensuring digital security and access to necessary resources, were also exacerbated by the remote setup.
Despite these challenges, working online in a shared video conference room was effective. We mapped out the availability of our volunteers and put together hour-long shifts of three to seven people. At least one leadership team member led every shift to provide consistency and coordination of assignments as volunteers exited and entered the space. By creating this shift schedule, we were able to maintain constant monitoring over several days without overworking any one individual. We established one video conference room that volunteers would hop into and out of based on their shifts. A number of specific roles needed to be filled during each shift: searching for content on different social media platforms, preserving content, geolocating it and so on.
At the start of their shift, volunteers were greeted by a manager, who then assessed the work in progress and assigned tasks. The video conference room sometimes became chaotic when news of large events broke and roles had to shift quickly. Even so, the speed of communication allowed the team to adapt to the evolving landscape.
3. Working with a Large Group is Difficult, but Worth It
From an organizational and communications perspective, working with such a large group presents its fair share of challenges. Each team member must be trained, onboarded, and given the resources necessary to feel supported throughout the research process. In order to facilitate such a large group project, the managerial team detailed specific monitoring roles beforehand. These included beginner monitors who could collect content mostly on Twitter and YouTube, advanced monitors who were versed in working with more challenging platforms like Parler and Telegram, managers to direct research and tackle any problems that arose, and archivists who captured and preserved relevant content using Hunchly and 4K Video Downloader.
These roles shifted and changed over time as we refined our methodology. For instance, we scaled back our preservation efforts after election day, choosing instead to preserve only content related to events we considered important. Having clearly defined roles allowed us to bring our large number of researchers onboard while also maintaining the flexibility to adapt roles as needed. Ultimately, it was the large size of this group, organized into specified roles, that allowed us to collect as much content as we did.
4. Incident Reports Make the Data More Digestible
One crucial step in determining how to make sense of the large quantity of content collected, and structure the data for incorporation into polished outputs, was the identification and in-depth documentation of notable events. The challenge here was translating our internal data collection into short, digestible chunks for Amnesty International’s researchers. We did this using chronology documents, separate Google Documents that we created if a particular protest turned violent or if an instance of voter intimidation appeared to be especially notable or severe. These incident reports were composed of a brief timeline, screenshots, and relevant content IDs from the master spreadsheet. The reports allowed researchers to get a quick overview of what we determined to be the most important incidents to highlight in eventual outputs down the road.
Take, for instance, the pro-Donald Trump “Stop the Steal” rally on November 4 outside the Maricopa County Elections Center in Phoenix, Arizona. Researchers on our team who were live-monitoring the rally began to gather open source content in which weapons were visible on some people there, and sheriff’s deputies inside the elections center. This immediately struck us as a notable event, given the presence of weapons and the potential for violent escalation. We thus created a new chronology document, providing an easily accessible overview of the rally.
5. Prioritize Ethics at Every Stage of the Process
Given that, for us, this project was rather close to home, we pushed ourselves to organize around two considerations: how to be ethical towards both our subject matter and our fellow researchers.
Throughout this process, we learned that it is vital we examine our positionality as researchers before, during, and after politically-charged projects like these in order to best treat our research subjects with the respect they deserve and to create ethical outputs. To do so, we follow practices like using virtual accounts and not interacting with any users or subject matter we come across.
The DVC and the Human Rights Center are well-versed in accounting for the well-being of our researchers. We have a “no questions asked” policy; a team member can switch projects or take a break without being obligated to disclose their reasoning. To mitigate exhaustion — especially given that, beyond the hours spent monitoring, most of us were tied to our screens checking election results — we limited all researchers, including those on the managerial team, to four hours of monitoring per day. We also created a separate Zoom room as a safe space for volunteers to decompress by talking about the work we were doing, sharing about our lives outside of the election, and playing music.
We worked hard to ensure our research was human-centered, rather than productivity-centred. This meant that we prioritized the wellbeing and needs of our researchers rather than pushing for outputs regardless of stress and fatigue.