
Haga clic aquí para leer la publicación del blog en español.
Introduction
Disappearances committed by state and non-state actors are one of Mexico’s most pressing issues. According to official figures, there are more than 100,000 missing persons in Mexico. The majority of these cases (80%) have been documented since 2007 due to the use of armed forces to counter drug-related activities in the country. The UN Committee on Enforced Disappearances has described the disappearances as a widespread phenomenon.
Consequently, groups of families with missing persons and authorities are carrying out search brigades to locate missing persons in different regions of the country. A fraction of these persons have been found in clandestine or hidden graves. According to NGOs and universities, more than 2,000 clandestine graves have been observed in Mexico since 2007.
Nonetheless, where to search for missing persons’ whereabouts remains a challenge to developing search and exhumation programs.
In this context, for over five years, our goal has been to use machine learning and geospatial techniques to develop technologies to support these searches. This blog post will describe a new approach to delimiting search areas where new clandestine graves may be found in the northwestern Mexican state of Baja California.
What we did
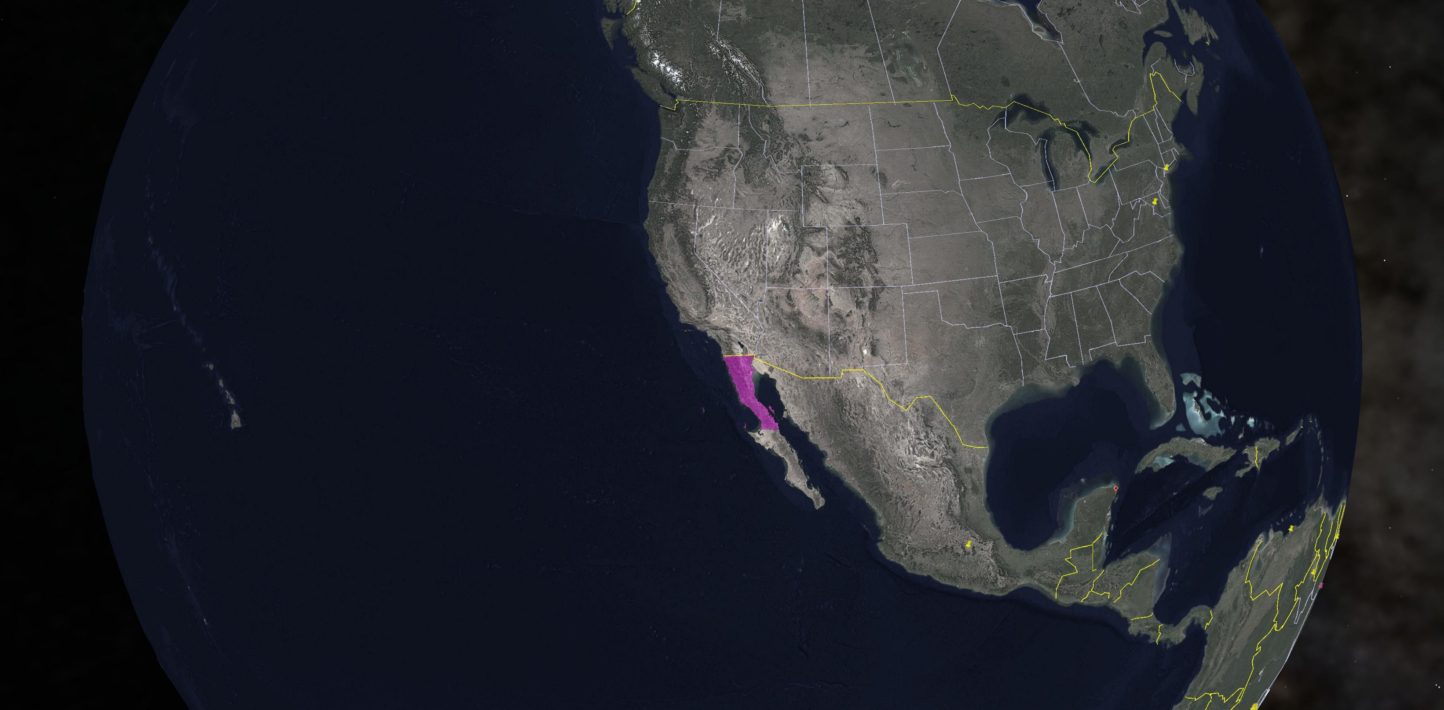
The state of Baja California is located in northwestern Mexico. It has an area of 71,450 km2 and a population of 3.7 million (a mere 3.0% of the country), 94% of which is concentrated in urban areas. Since 2007 it has been one of the states most affected by the phenomenon of disappearances: according to figures from the Attorney General of the State of Baja California (FGEBC), 12,000 people have disappeared in that time period. Likewise, the findings of clandestine graves have been recurrent in the region.
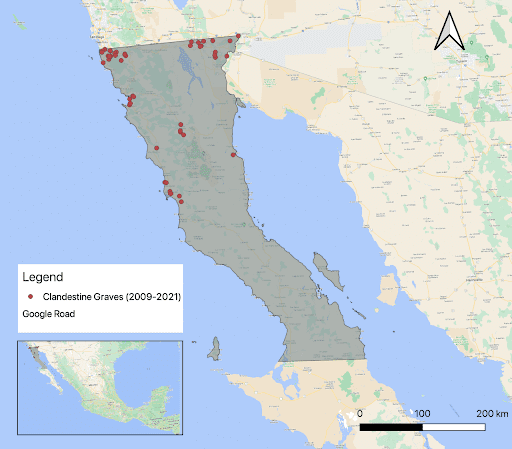
By making freedom of information requests to the FGEBC, we were able to obtain data on 144 clandestine graves that have been observed between October 2009 and February 2021. Of this total, 52 graves included the latitude and longitude of the site where they were located by the authorities.
It is essential to take into account the possible biases of the information.
The graves observed by the FGEBC may be a specific type of grave which the authorities are able to “observe.” This is constrained by proximity to urban areas, a specific type of perpetrators, or resources that authorities can access to conduct search brigades.
Furthermore, although the coordinates were verified, there is a possibility of inaccuracy by some meters, depending on how the local authorities registered them.
We decided to use these 52 points as training data to develop a new spatial analysis model that delimits areas in the entity where it is likely that new clandestine graves will be located in the region. This new approach includes three combined methods: Point pattern analysis, accessibility combined with visibility analysis, and hyperspectral analysis.
Below we explain the steps developed.
(1) Point pattern analysis
We first conducted spatial point pattern analysis of the 52 grave sites that the FGEBC has located. The objective is to determine the clustering of the points in the study area. If multiple groups of graves are found in close proximity to each other, then we can assume graves will not likely be in a random location, but in specific areas according to their spatial pattern. Furthermore, we can infer the distance of graves that have not yet been found based on the clustering patterns of the previous points.
Specific tests such as Average Nearest Neighbors (ANN) and Ripley’s K function have been suggested by Congram, Green and Tuller as appropriate methods to detect clustering and infer these locations in contexts of international or non-international armed conflicts where people have gone missing. We conducted an ANN test using QGIS and Ripley’s K function and its L(d) transformation function using the R programming language on the 52 points in Baja California.
The ANN test (0.42 ratio and a Z-Score of -8.009) indicated highly significant clustering, with an observed mean distance of 7 km (average distance between observed graves in Baja California) and an expected mean distance of 16 km (average distance of graves in Baja California if the event is random). These results suggest that observed clandestine graves sites in Baja California are not selected randomly by perpetrators; they are clustered in specific areas of the state.
Since clustering was detected, we then implemented Ripley’s K function and its L(d) transformation to determine the distance in kilometers of possible new gravesites, taking as a starting point the sites that have been previously discovered.
Our results indicate that new graves in the state of Baja California may be located at distances between ~18 km and ~28 km range from a known grave point.
In other words, if we stand at a point where a grave was previously located, there is a high probability that we will find more graves at a distance of 18 km – 28 km due to the conglomeration pattern of the points.
(2) Accessibility and viewshed analysis
The illegal nature of clandestine graves forces perpetrators to choose hidden sites, such as canyons or wooded areas, to guarantee their privacy during the burial. Given such privacy requirements, the landscape structure, conformed mainly by terrain and vegetation, must play a crucial role in the selection of a burial site. On the other hand, the geographical context imposes accessibility restrictions (road infrastructure), especially because the movement of people against their will, or of human remains, requires fast and discrete transportation. These notions led us to conceptualize the geographical space in terms of two key concepts, namely the spatial accessibility and the spatial privacy that must be relevant to clandestine grave locations.
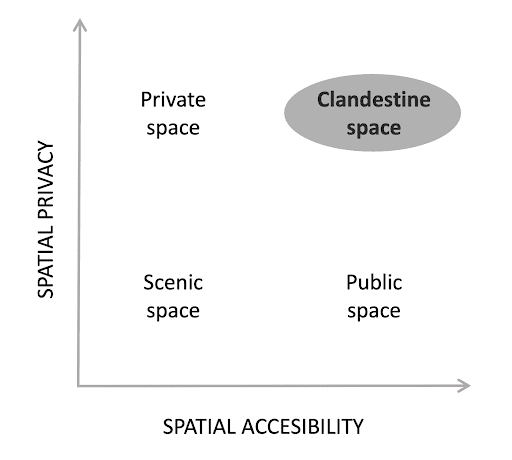
The two quantifiable concepts, accessibility and visibility, define dimensions of analysis that allow us to partition the geographical space into four classes as outlined in Fig. 1. Areas of large accessibility and low privacy are referred to as the public space whereas areas with low accessibility and large privacy define the private space. In between these two extreme cases there are two other combinations, namely, the scenic space having jointly low accessibility and low privacy, and the clandestine space having jointly high accessibility and high privacy. We hypothesize that clandestine graves are more likely to be found in the latter, and therefore a delineation of such kinds of spaces will provide a prioritization scheme for search tasks.
We generated two masks of Baja California by taking into account the concept of clandestine space (CS). These dimensions were, in turn, quantified in terms of travel time and percentage of visibility, respectively. In principle, the CS will present a greater probability of containing clandestine graves under the premise that, in order to reduce the risk of being caught, perpetrators choose sites that are quickly accessible and not highly visible to the public.
The CS concept is obtained through geospatial modeling using MATLAB. The geographic space is divided into cells on which both the travel time from an urban settlement and the visibility index are calculated.
Spatial accessibility is calculated as an accumulated cost function from the closest urban cell to each point in geographic space, where the cost function is the time it takes to cross the cell. This value is determined from the maximum speeds of the roads, the terrain slope, and the fraction of vegetation cover. Spatial privacy is calculated as the frequency of the point at the line of sight of an observer located on nearby roads, where the range of visibility is limited to a few kilometers. The calculation is carried out by accumulating the viewsheds of a digital terrain model with random viewpoints located on the road network.
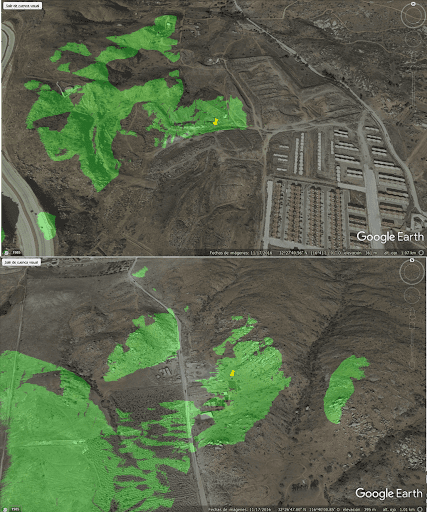
An alternative way to understand the visibility is as follows. Consider Fig. 2 where the green area highlights the viewsheds for a couple of points where human remains had been discovered. The visibility of those points can then be understood as the intersection of major roads with the green area. In these cases there is low visibility, as most of the viewshed extend over areas not traversed by major roads and/or settlements.
(3) Nitrogen Accumulation or hyperspectral analysis
When a body decomposes, it releases nutrients to the soil, among which nitrogen (N) stands out. This is because the human body contains an average of 2.6 kg of N, an amount that distributed in an area of 3 square meters is equivalent to 50 times the amount recommended to fertilize shrubs or trees in temperate zones. The N content of plants is directly related to the chlorophyll concentration in the leaves. Fortunately, leaf chlorophyll concentration can be quantified using vegetation indices, such as the so-called Red-edge Chlorophyll Index (RECI). A recent study with animals indicated that burials could be discovered from the detection of accelerated growth in the leaf chlorophyll content of plants that were detected through spectral indices, with the RECI being one of the most effective (Silvan et al., 2021).
Among the satellites acquiring images that can be used to compute the RECI are those from the European Space Agency’s Copernicus programme, called Sentinel-2A and Sentinel-2B. These began operating in 2015 and 2017, respectively, delivering one image every six days.
An index was built to account for the increase of RECI from images acquired by the Sentinel-2A/B constellation from 2016-2020 in Baja California. The index, here referred to as Nitrogen Accumulation Index (NAI), is a number between 0-100 that indicates how fast the RECI grows within the monitoring period, where an NAI value of 30 or higher indicates an overall positive trend of the time series.
In practice, because other human-induced or natural processes may contribute to N accumulation, such as water runoff and field crop fertilization, the interpretation of the NAI layer should consider spatial and contextual patterns. For instance, a large field with high NAI values is unlikely to be caused by a burial. The relatively low spatial resolution of the satellite images (10 meters per pixel) limits the use of the NAI layer to the detection of rather large burials (say, of several dozens of bodies).
One of the few cases of a mass grave discovered in Baja California was reported by several newpapers in January 2020. It was found on a land parcel located in Maclovio Rojas, an area in the city of Tijuana, and contained a dozen bodies.
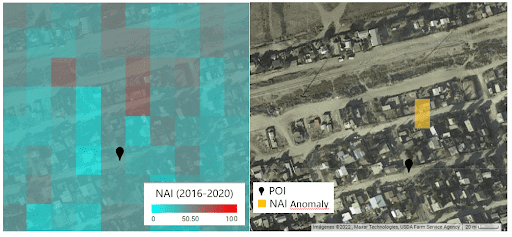
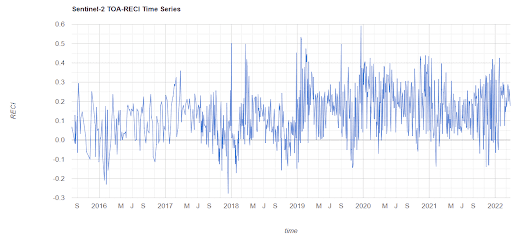
Fig. 3. NAI distribution around the location of a mass grave on Maclovio Rojas, Tijuana (top-left), the area where the NAI reached a value above 50 (top-right) and the RECI time series for that area (bottom).
Fig. 3 shows the distribution of the NAI index around that location (top-left), where the red tone highlights the areas where the RECI appeared with positive trend throughout the period of 2016-2020. The area where NAI reaches a value above 50 and intersects with the clandestine space mask is also shown in that figure (top-right) together with the corresponding plot of the RECI value throughout the period. The variation of the RECI is explained by the variations in the atmospheric and soil humidity conditions at the image capture rate. Nonetheless, what matters most is the overall trend of the time series, which is actually the idea behind the NAI image. The closest NAI anomaly was observed around 25 meters north of the point of interest (POI). Although we cannot claim such an anomaly is related to the mass grave of Maclovio Rojas, we cannot discard that image pixels are likely to present spatial location misalignments with respect to the base map, which would explain such a relative displacement.
Results
The results of these three approaches were integrated into a Google Earth Engine app that allows one to visualize and explore them.
We found that 41 of the 52 georeferenced grave sites were located in areas that are easily accessible but have low visibility, complying with the notion of clandestine space.
Likewise, we identified that 32% of the territory of Baja California meets these characteristics (high accessibility and low visibility). Therefore, these are already potential areas to start new searches for missing persons.
To develop these results, we intend to reduce this potential area further. Taking into account the L(d) test results, we generated circular buffers with a radius between 18 and 28 km, around the grave points previously observed by the FGEBC. By creating intersections of these zones with the buffers of those that meet the clandestine space criteria, we established that the potential search zone could be reduced by another 10%. Therefore, the final search areas are warranted to be within reasonable distances from most urban settlements, 39 minutes in the case of Baja California. However, we stress that we cannot pinpoint the exact place or direction for searching brigades.
Furthermore, the accumulations of nitrogen observed through satellite images could indicate anomalies in the ground, where it is presumed that bodies could be buried, complementing the results from the clandestine space masks and the point pattern analysis when an area has been defined.
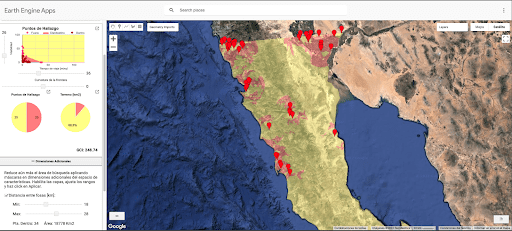
Map 2. Online platform that demonstrates the use of the Clandestine Space boundary model and its integration with the ring masks from point pattern analysis. Red zones indicate potential search areas.
Next steps
For this project, we have the following next steps:
- Try to reduce the potential search area further, complementing it with other machine learning approaches. Specifically, we are implementing a supervised machine learning algorithm that we have used previously, known as random forest.
- Obtain more information from georeferenced points of clandestine graves that come from other sources of information to reduce the possible biases of using a single source.
- Generate context studies that allow us to identify the dynamics and patterns of the disappearance of persons in the area of concern. This will allow us to better complement the results obtained.
- Hold meetings and workshops with groups of relatives in search of missing persons and with authorities such as the National Commission for the Search of Disappeared Persons. We believe that our results can be used for search and exhumation programs for people in the state of Baja California.