
This post was written for the Al Jazeera ‘Open Source Investigations Handbook’, which is available in English and Arabic.
In the Crisis Evidence Lab at Amnesty International, we use digital 3D models to both generate new findings (evidentiary) and to communicate existing findings (demonstrative).
It is worth comparing them to their analogue counterparts, that is, physical architectural models. Architectural models can be quick sketches, conceived to check the viability of an idea or richly detailed presentations that take months to produce. They can be made to different scales: from a tiny detail study to a city-scale model that fills an exhibition room.
Digital models can be all these things too, either separately or all at once. They can contain many different layers of data that can be turned on and off or overlaid. They can be zoomed almost infinitely, enabling 3D and 2D elements to be viewed together at different scales.
In the work of the Crisis Evidence Lab, digital models become operational in multiple ways at different stages of an investigation. They can be containers for organising evidence – including photos, videos, satellite imagery, drawings, witness testimony – in time and space. Through this process we gain new insights into the research materials, revealing details not readily apparent when analysing the media independently. Lastly, we use models as presentation devices: to publish often complex findings in print, video and interactive visualisations.
The investigation
Our most recent model was built to accompany an in-depth report and press release on the 16 March 2022 attack on the Donetsk Academic Regional Drama Theatre in Mariupol, Ukraine. Amnesty International interviewed more than 50 survivors and witnesses, and collected extensive digital evidence. The investigation concluded that Russian military forces likely deliberately targeted the theatre with air strikes, despite knowing hundreds of civilians were sheltering there on 16 March, making the attack a clear war crime.
A key secondary finding is that the damage to the theatre, although devastating, was relatively localised, and the death toll was probably lower than previous counts published by local authorities and international media. Witnesses described how the blasts caused severe damage and multiple fatalities in certain areas and left other areas protected from the explosion.
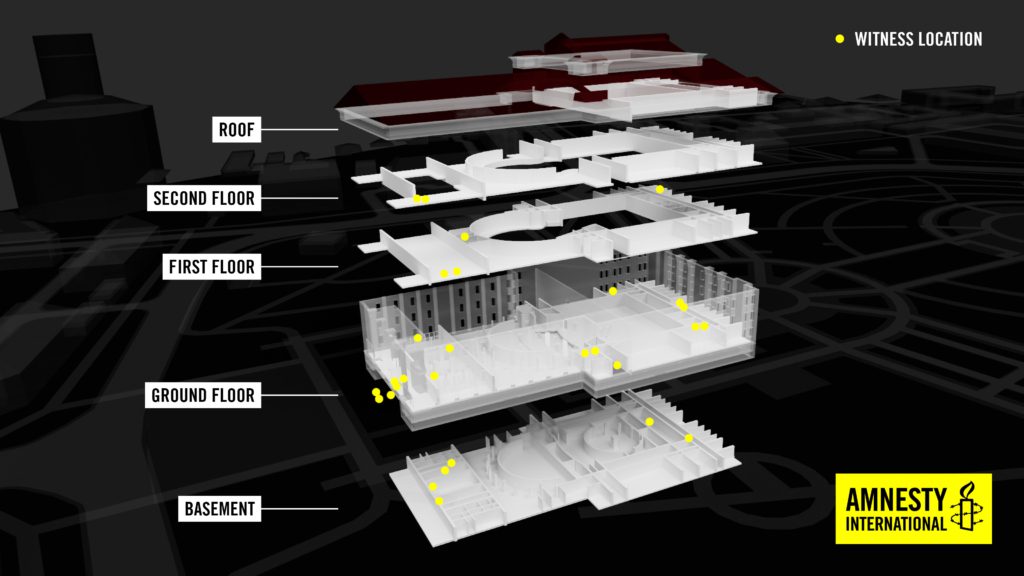
To better understand the impact of this attack, we built a 3D model which we overlaid with witness locations and testimonies about areas of greatest damage, photos and videos, as well as a mathematical model of the blast wave. By doing this as a volumetric 3D model rather than 2D floor plans, we can visualise the layers in place, and explore the damage from multiple angles with more clarity.
Building the 3D model
We started by reconstructing in 3D the overall dimensions of the theatre using photos from before the attack. By teaching the 3D software which are the main features defining the perspective of the photo, it is possible to ‘solve’ the camera, and establish a good estimate for camera position and focal length. In doing so, we can reference the image to model exterior details in the correct proportions. The overall scale can then be corrected using satellite images, or referencing objects of known sizes in the photos, such as cars or street furniture.
Initially, we only had access to hand-drawn plans of the interior of the theatre, produced by a witness who made measured drawings of the layout. Subsequently we were given access to full CAD (Computer Aided Design) plans, produced when the building was refurbished in 2018, which made all interior details clear. At this point it was straightforward to trace the plans and extrude the walls of each floor. We stacked them in 3D using clues from interior and exterior photos, as well as stair details, to estimate floor heights.
We used 3D software to geolocate the building accurately on satellite imagery, and then imported Open Street Map data to generate the surrounding buildings, roads, and open spaces in that area of Mariupol.
This city district-level context was important for establishing the relative geographic isolation of the theatre to other buildings, when considering the intentionality of its targeting. It is often common to treat 3D models of buildings as ‘objects’, floating in space, and viewed from afar. By anchoring the building in its urban context, we establish its scale and relationship to a living city, as well as the significant portion of it that was underground.
Representing the damage
We took the decision not to model any of the damage to the building. This can work for certain investigative or diagrammatic purposes, but here it was far better to use the model as the backdrop to overlay photos of the damage, which are far more revealing. In this way, the model becomes a representation of the building prior to the attack, and a container for the media recorded afterwards.
The model becomes a representation of the building prior to the attack, and a container for the media recorded afterwards
To locate images in the model, we used a similar method to the one described earlier, using perspective lines to calculate the camera position and focal length – or by reading the focal length from the metadata, if available – and then estimating the position manually.
Moving between photos and videos in the model is a powerful way to map the spatial or geographic dimension of an investigation. Moving from image to image while using the model as a backdrop helps the viewer to visualise a sequence of events in time and space.
Publication
When time came to present the model, rather than building an interactive platform, we opted for a scripted explainer-style video, with a voiceover from a Ukrainian colleague that guides the viewer through events in lay terms for a general audience. This allowed us to incorporate not only the 3D model and overlaid media showing structural damage to the theatre, but also other elements including open- and closed-source footage, satellite imagery and an animated timeline of events. Additional outputs were a series of short clips and stills that were included in the report, shared across the Amnesty movement, and published on social media.
Building a 3D digital model gives us great flexibility in producing drawings and animated segments that evolve alongside the script as it is refined. These segments can be exported in low resolution to check timing and script beats, iterated upon and then rendered at full quality. By cutting into or ‘exploding’ parts of this model we were able to show how the ordnance penetrated the main theatre space with minimal resistance except for the roof, before exploding at stage level.
In this investigation, the 3D model served to synthesise the testimonies and other evidence into an overall view that convincingly corroborated the areas of damage against locations with known fatalities or survivors. It also served as a narrative and illustrative device in support of the detailed report. By incorporating the model into a six-minute video we aimed to make the findings of a highly technical and often exhaustive investigation accessible to a wide audience.
For more Al Jazeera Media Institute publications, visit: institute.aljazeera.net/en/publications.