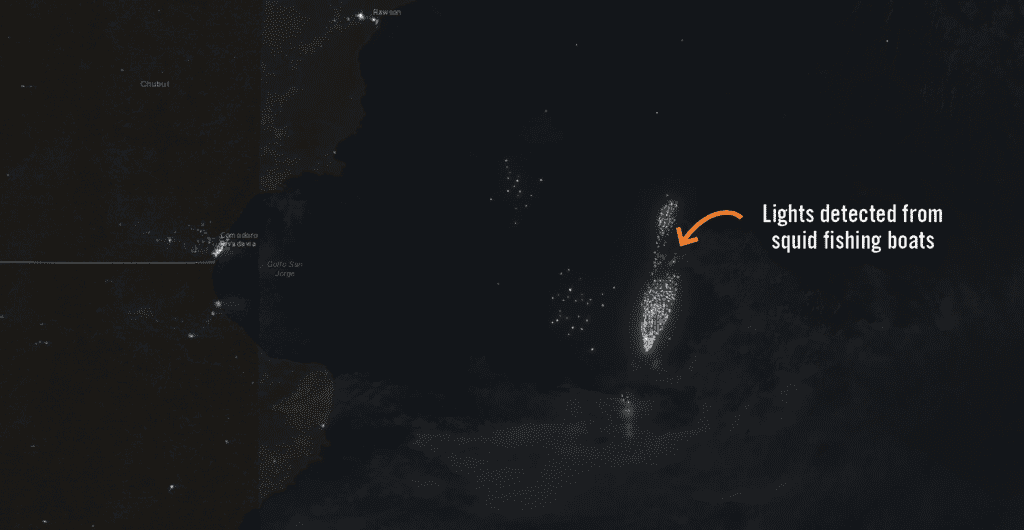
One of the main remote sensing datasets used for human rights research is ‘fire data’. Fire data is an algorithm applied to measurements taken from space with environmental monitoring sensors aboard satellites. The algorithm uses those measurements to pinpoint thermal anomalies (also known as hotspots) or active fires on earth. The data was originally intended to track forest fires globally in near-real time but has also been used to monitor smoke related to health issues, observe security at oil pipelines, track fishing vessels, and verify human rights abuses, among other applications. There are currently three openly available datasets varying in spatial resolution and historical record: MODIS Collection 6, VIIRS S-NPP 375m and VIIRS NOAA-20 375m. While I will provide a brief explanation of the MODIS sensor, the focus will be on VIIRS fire data and how it is used to support the documentation of human rights abuses.
A little nerd time
The MODIS (Moderate Resolution Imaging Spectroradiometer) Collection 6 instrument has a high temporal revisit rate, covering the earth’s surface every one to two days since 2000 at a spatial resolution of 1000 metres. The historical comparison of thermal anomalies can be especially important to research certain types of phenomena, such as deforestation and climate change. MODIS was also an innovative tool used to document the large-scale government campaign that burned thousands of villages in Darfur, Sudan beginning in 2003. In 2012, VIIRS (Visible Infrared Imaging Radiometer Suite) S-NPP 375m came online, increasing the resolution considerably and making it the strongest fire data source for human rights research.
VIIRS are instruments added to the joint NASA/NOAA Suomi National Polar-orbiting Partnership (VIIRS S-NPP 375m) and NOAA-20 (VIIRS NOAA-20 375m) satellites. The spatial resolution is approximately 375 metres with a temporal resolution of at least twice per day. This has allowed increased detection and confidence in thermal anomalies on the earth’s surface during both the day and night.
The improved resolutions have helped to verify the time and location of violent human rights events in which areas or objects are burned in remote places in the world at any time, sometimes even if clouds obscure visual observations.
Everything is burning
First, it is important to understand that in many places in the world, fire is routinely used in the process of land management. Many plants, referred to as pyrophytes, in Australia and the USA are dependent upon naturally occurring fires for germination, and small-scale farmers across the globe use fire — or ‘slash and burn’ — agricultural practices to clear fields and fertilize the soil.
In many parts of Africa, there is a ‘fire season’. Below, you can see that, at certain times of year, large swathes of Sub-Saharan Africa are on fire and this moves southward as the year progresses. Many of these fires are part of historical agricultural processes and others are simply a system for managing grasses for livestock, hunting animals or even deterring animals from areas. While living in a village in Zambia, for example, we used fire to prepare fields for planting, hunt rodents such as mice, and clear grasses from around houses to deter poisonous snakes.
While fires are common for local land management worldwide, there have been documented increases in these types of fires in areas such as the Amazon that are concerning for environmental and human rights observers.
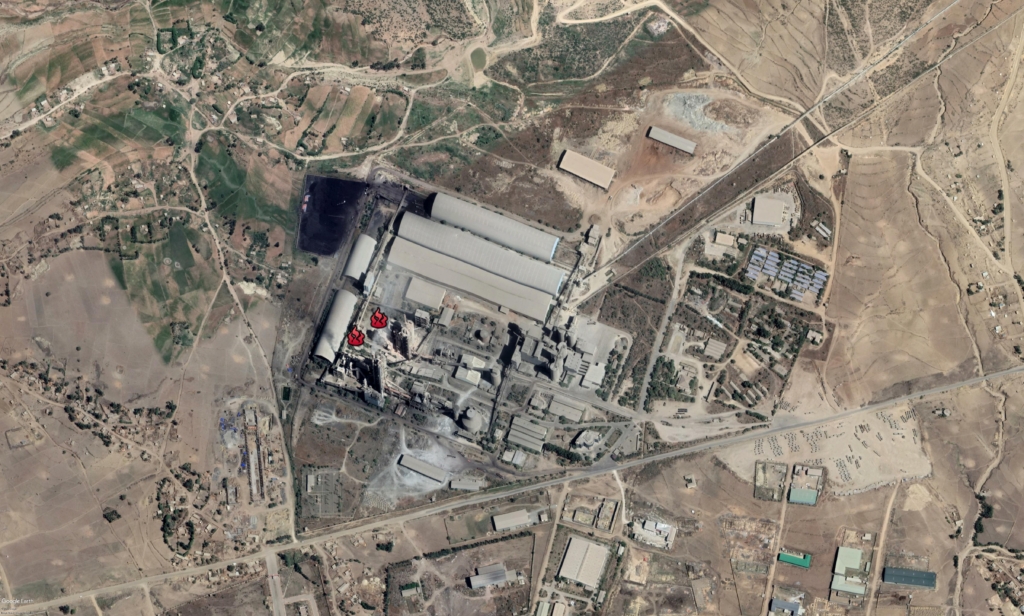
Something to remember when analysing fire data is that the points are derived from algorithms applied to measurements captured by sensors. These algorithms have improved over time, producing more accurate results, but there are still false positives and many fires that will be missed. That a hotspot was detected does not mean there was an active fire, but overall, if a hotspot was not detected, a fire could have still occurred. Oil wells, factories and other artificial objects produce heat that could be mistaken for fire. Also, while the algorithms have been conservatively calibrated to avoid capturing instances of sun glinting off objects, there could still be false positives associated with the reflectance. Other data sources, such as satellite imagery, should always be used to verify hotspots and mitigate inaccurate analysis from false positives.
How fire data can be used for human rights research
Used correctly, fire data can be an excellent source of information for near-real time corroboration of possible abuse events and for tipping and cueing human rights researchers on the general location.
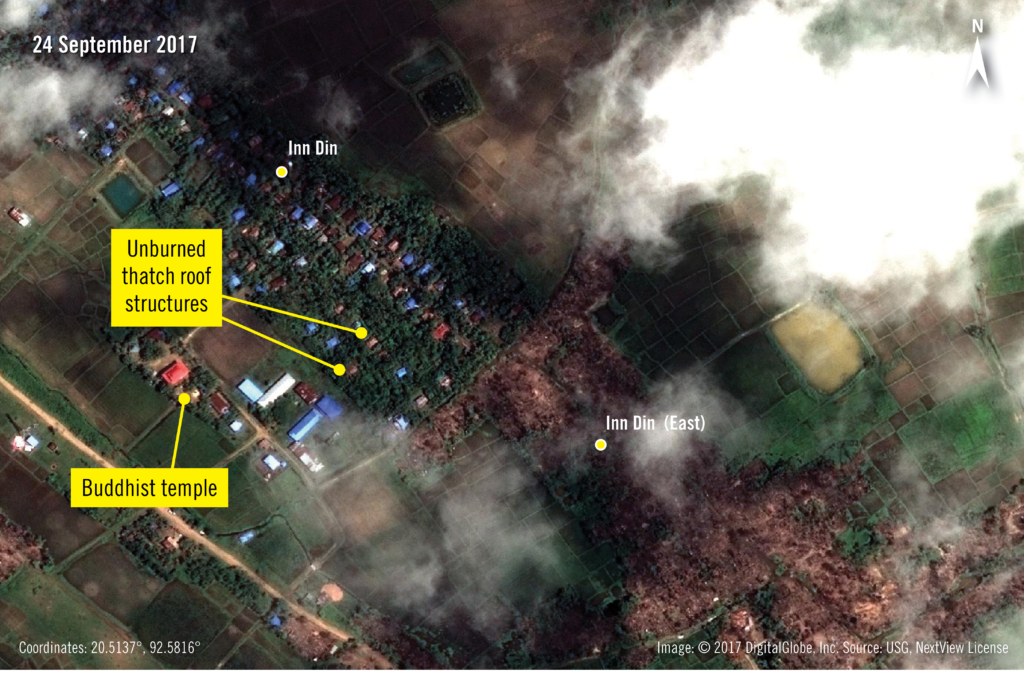
CASE STUDY: RAKHINE STATE 2017
During the military campaign in Rakhine State, Myanmar in 2017, no access was granted to journalists or human rights researchers. The information we were getting from contacts on the ground was chaotic and very concerning, but we were still unable to understand the scale of the events. Our only source of information in those first days were some local contacts on the ground and fire data.
In 2017, most satellite images were being captured between 10 am and 12 pm local time. Since it was the nearing the end of the rainy season in Rakhine State, even if multiple satellites were capturing images on the same day, they were all subject to similar extensive cloud cover shrouding a clear view of the ground.
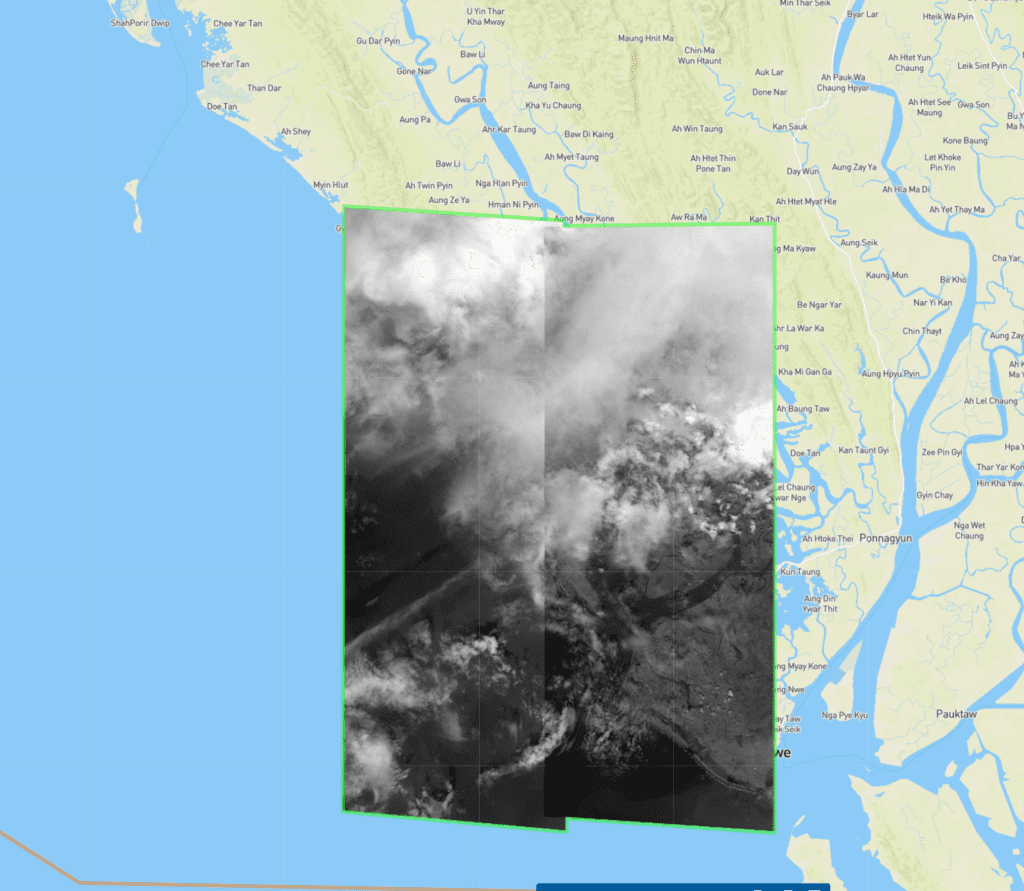
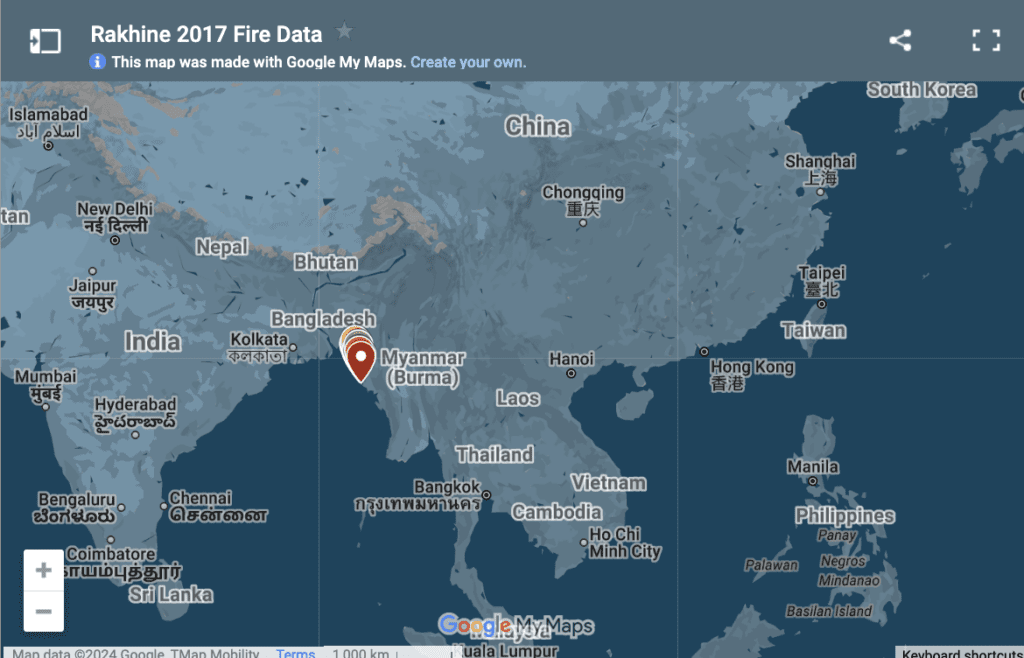
An advantage of VIIRS fire data is that the sensors detect hotspots multiple times per day, and sometimes these thermal heat signatures can even be determined through thin cloud cover. With VIIRS and MODIS data we were quickly able to document some possible locations and times of fires and see the massive scale of the situation which supported theories that this was a planned military operation. The map below shows the scale of the fires starting in August 2017.
When clear imagery was finally captured, we could narrow our search areas based on the hotspots from the fire data and from testimonies slowly feeding through as people crossed the borders into Bangladesh.
Multiple data sources corroborating the time of events will further add to the validity of the evidence documenting abuses against the Rohingya people during criminal proceedings, such as those being prepared by the International Court of Justice (ICJ) and the Independent Investigative Mechanism for Myanmar (IIMM).
How to access VIIRS data and conduct your own research
By far the simplest way to access VIIRS fire data is through online maps such as these:
If bandwidth is an issue or you would like more control of the data, another method is to download the data from the last seven days, or a specific timeframe over a particular country or area and load that data into Google Earth Pro or other geospatial data viewing tool:
Test case from recent events in Darfur, Sudan
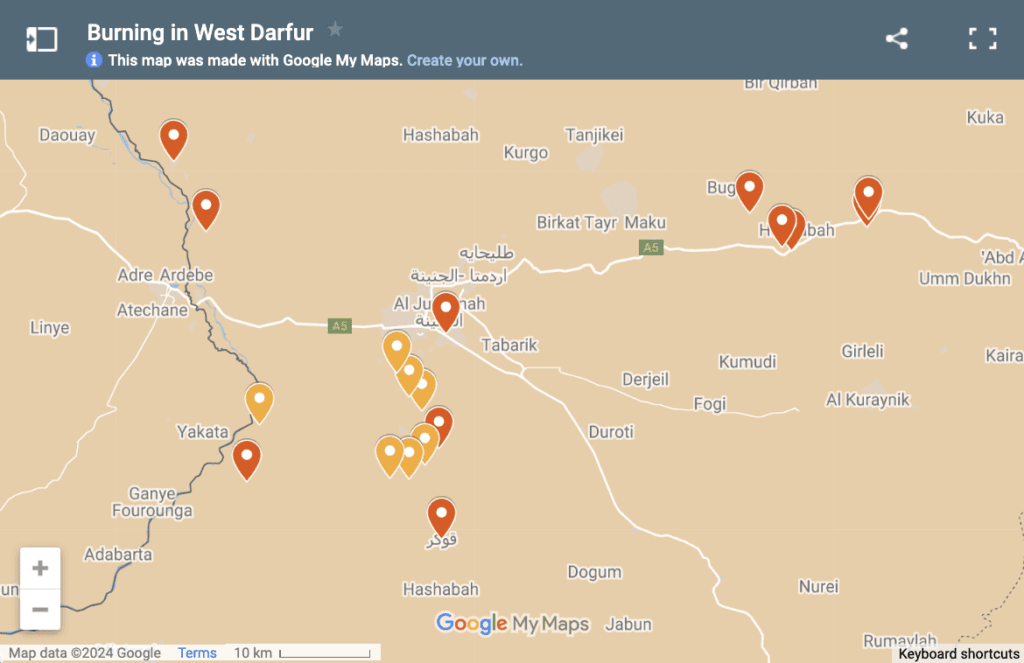
On 17 January 2021, reports began to surface of fighting and possible fires in West Darfur, Sudan. This was concerning news since the UN had ended their Darfur mission on 1 January 2021. The first reports were based on events in El Geneina, but based on experience working on Darfur, we suspected that more areas had been impacted.
These are the simplified steps to accessing, downloading and using VIIRS fire data to look into this situation:
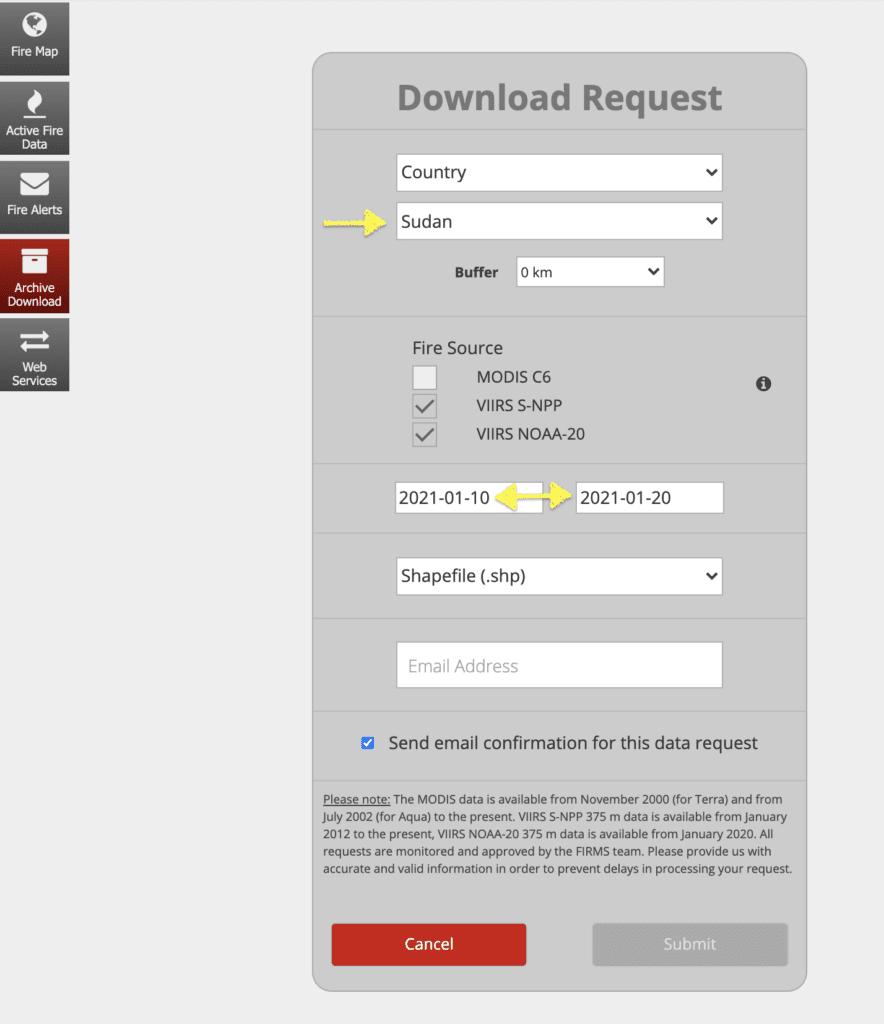
1. One of the quickest and easiest methods to check for burning is to download the seven-day shapefile data from VIIRS mentioned above. To find the same dataset for Sudan though, check out the link to ‘Order archive data’ above and order VIIRS imagery between January 10 -January 20, 2021 for Sudan
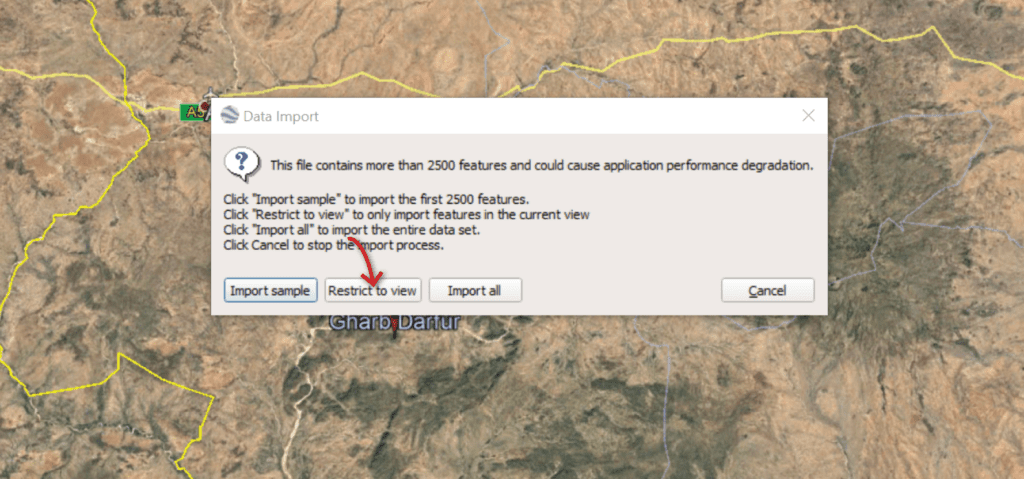
2. Then go to West Darfur in Google Earth Pro Desktop and load both VIIRS data sets and select ‘Restrict to View’. If you are zoomed in close enough, you will prevent a lot of noise created by the seasonal fires in the area.
3. Next, look at the points and try to categorize them by where the hotspots intersect with populated areas.
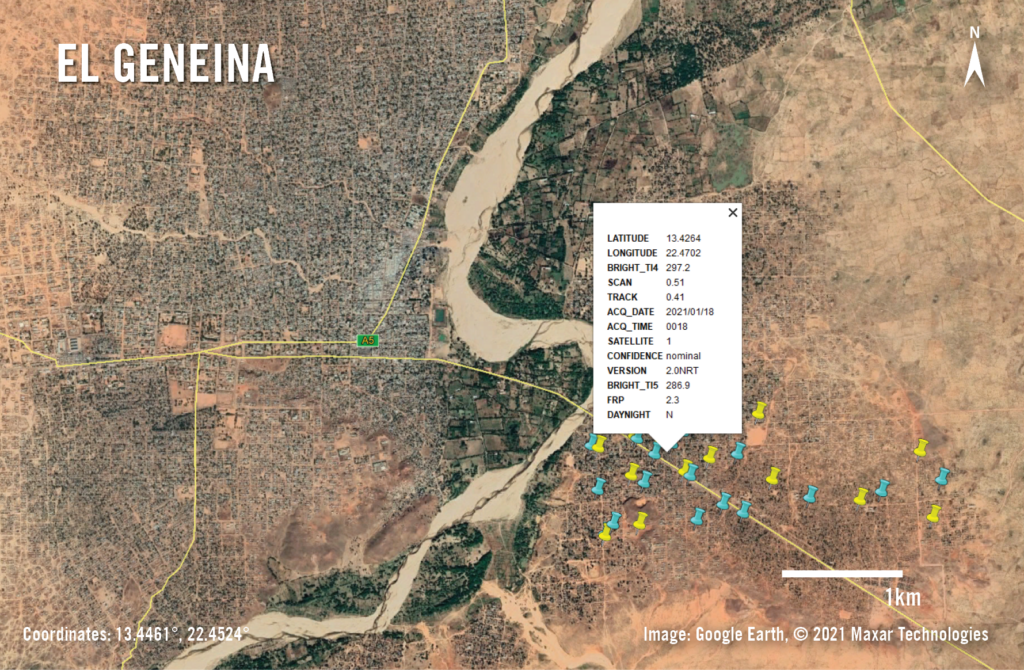
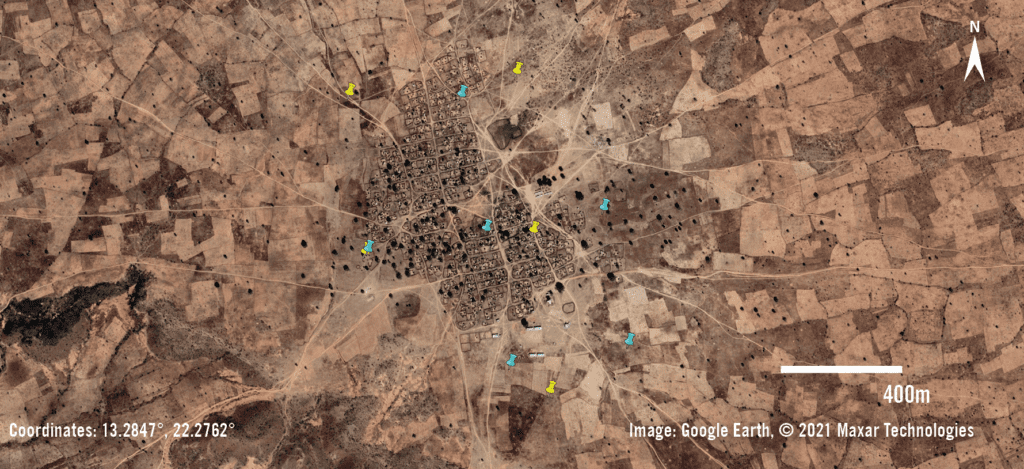
- Since the reports spoke specifically of a refugee camp in El Geneina and without knowing where exactly the camp is, zoom into the city and look at the area where both hotspots were detected by VIIRS sensors:
- Continue checking for other areas where the hotspots intersect with populated areas:
- Also check out the large number of points where the hotspots do not seem to intersect with any populated areas:
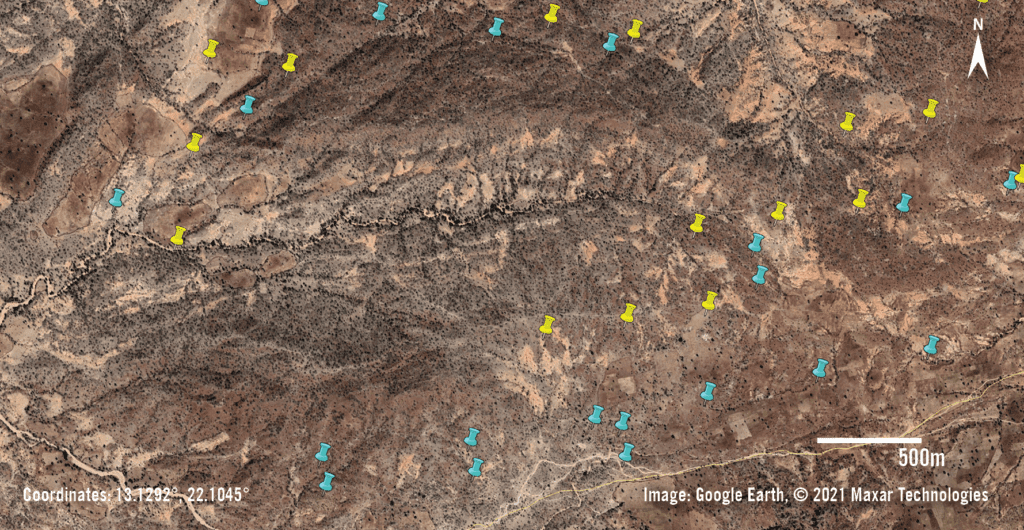
- Then look at areas where it was difficult to tell if the fires impacted the populated areas, or if they were another use of fire to clear land:
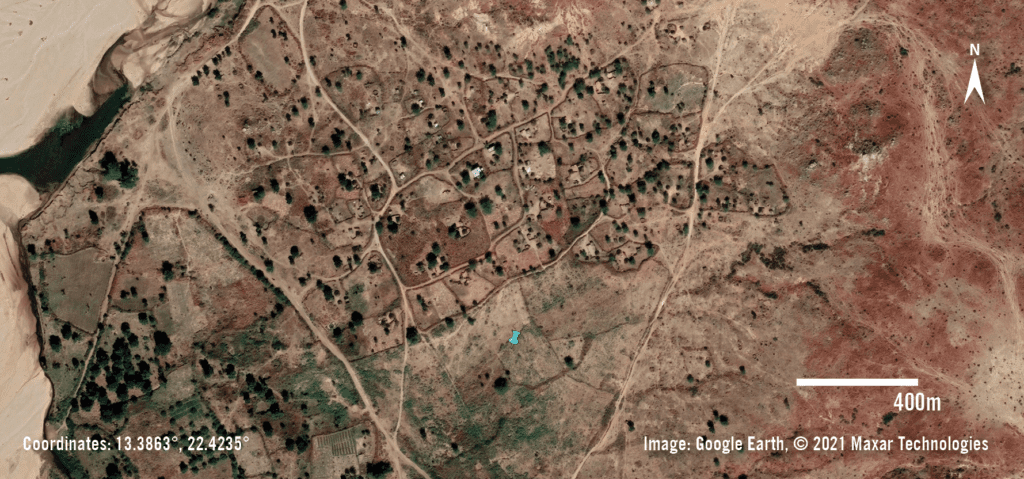
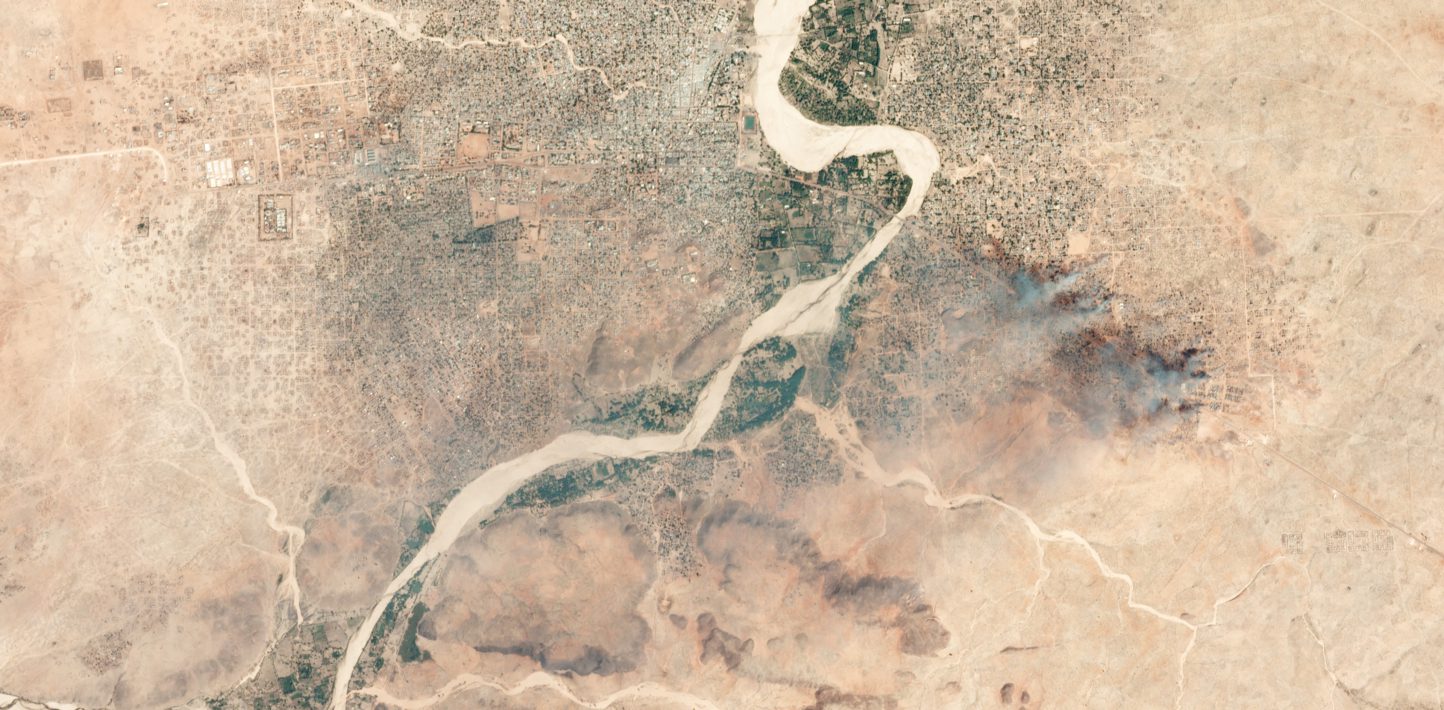
With this information, one should be able to pinpoint ten villages that were likely burned and could use satellite imagery from Planet Labs and open-source imagery from the European Space Agency (ESA) to verify each hotspot.
All ten hotspots had been heavily burned between 16-19 January, and with the location of those ten villages, I was able to confirm burning in seven other nearby villages using the open-source satellite imagery.
Final Note
Please remember, while VIIRS fire data is an excellent source of near-real time information for human rights research, it should always be verified in conjunction with other information before any conclusions can be made.
Banner image: © 2021 Planet Labs, Inc