
In this three-part series, we focus on key elements behind the successful crowd-sourcing project, Decode Surveillance NYC, including the design of the data collection, early analysis, and what it means to build community online.
In this first post, the authors outline how the team worked to define the research question and design the crowdsourcing of the data.
Designing the data
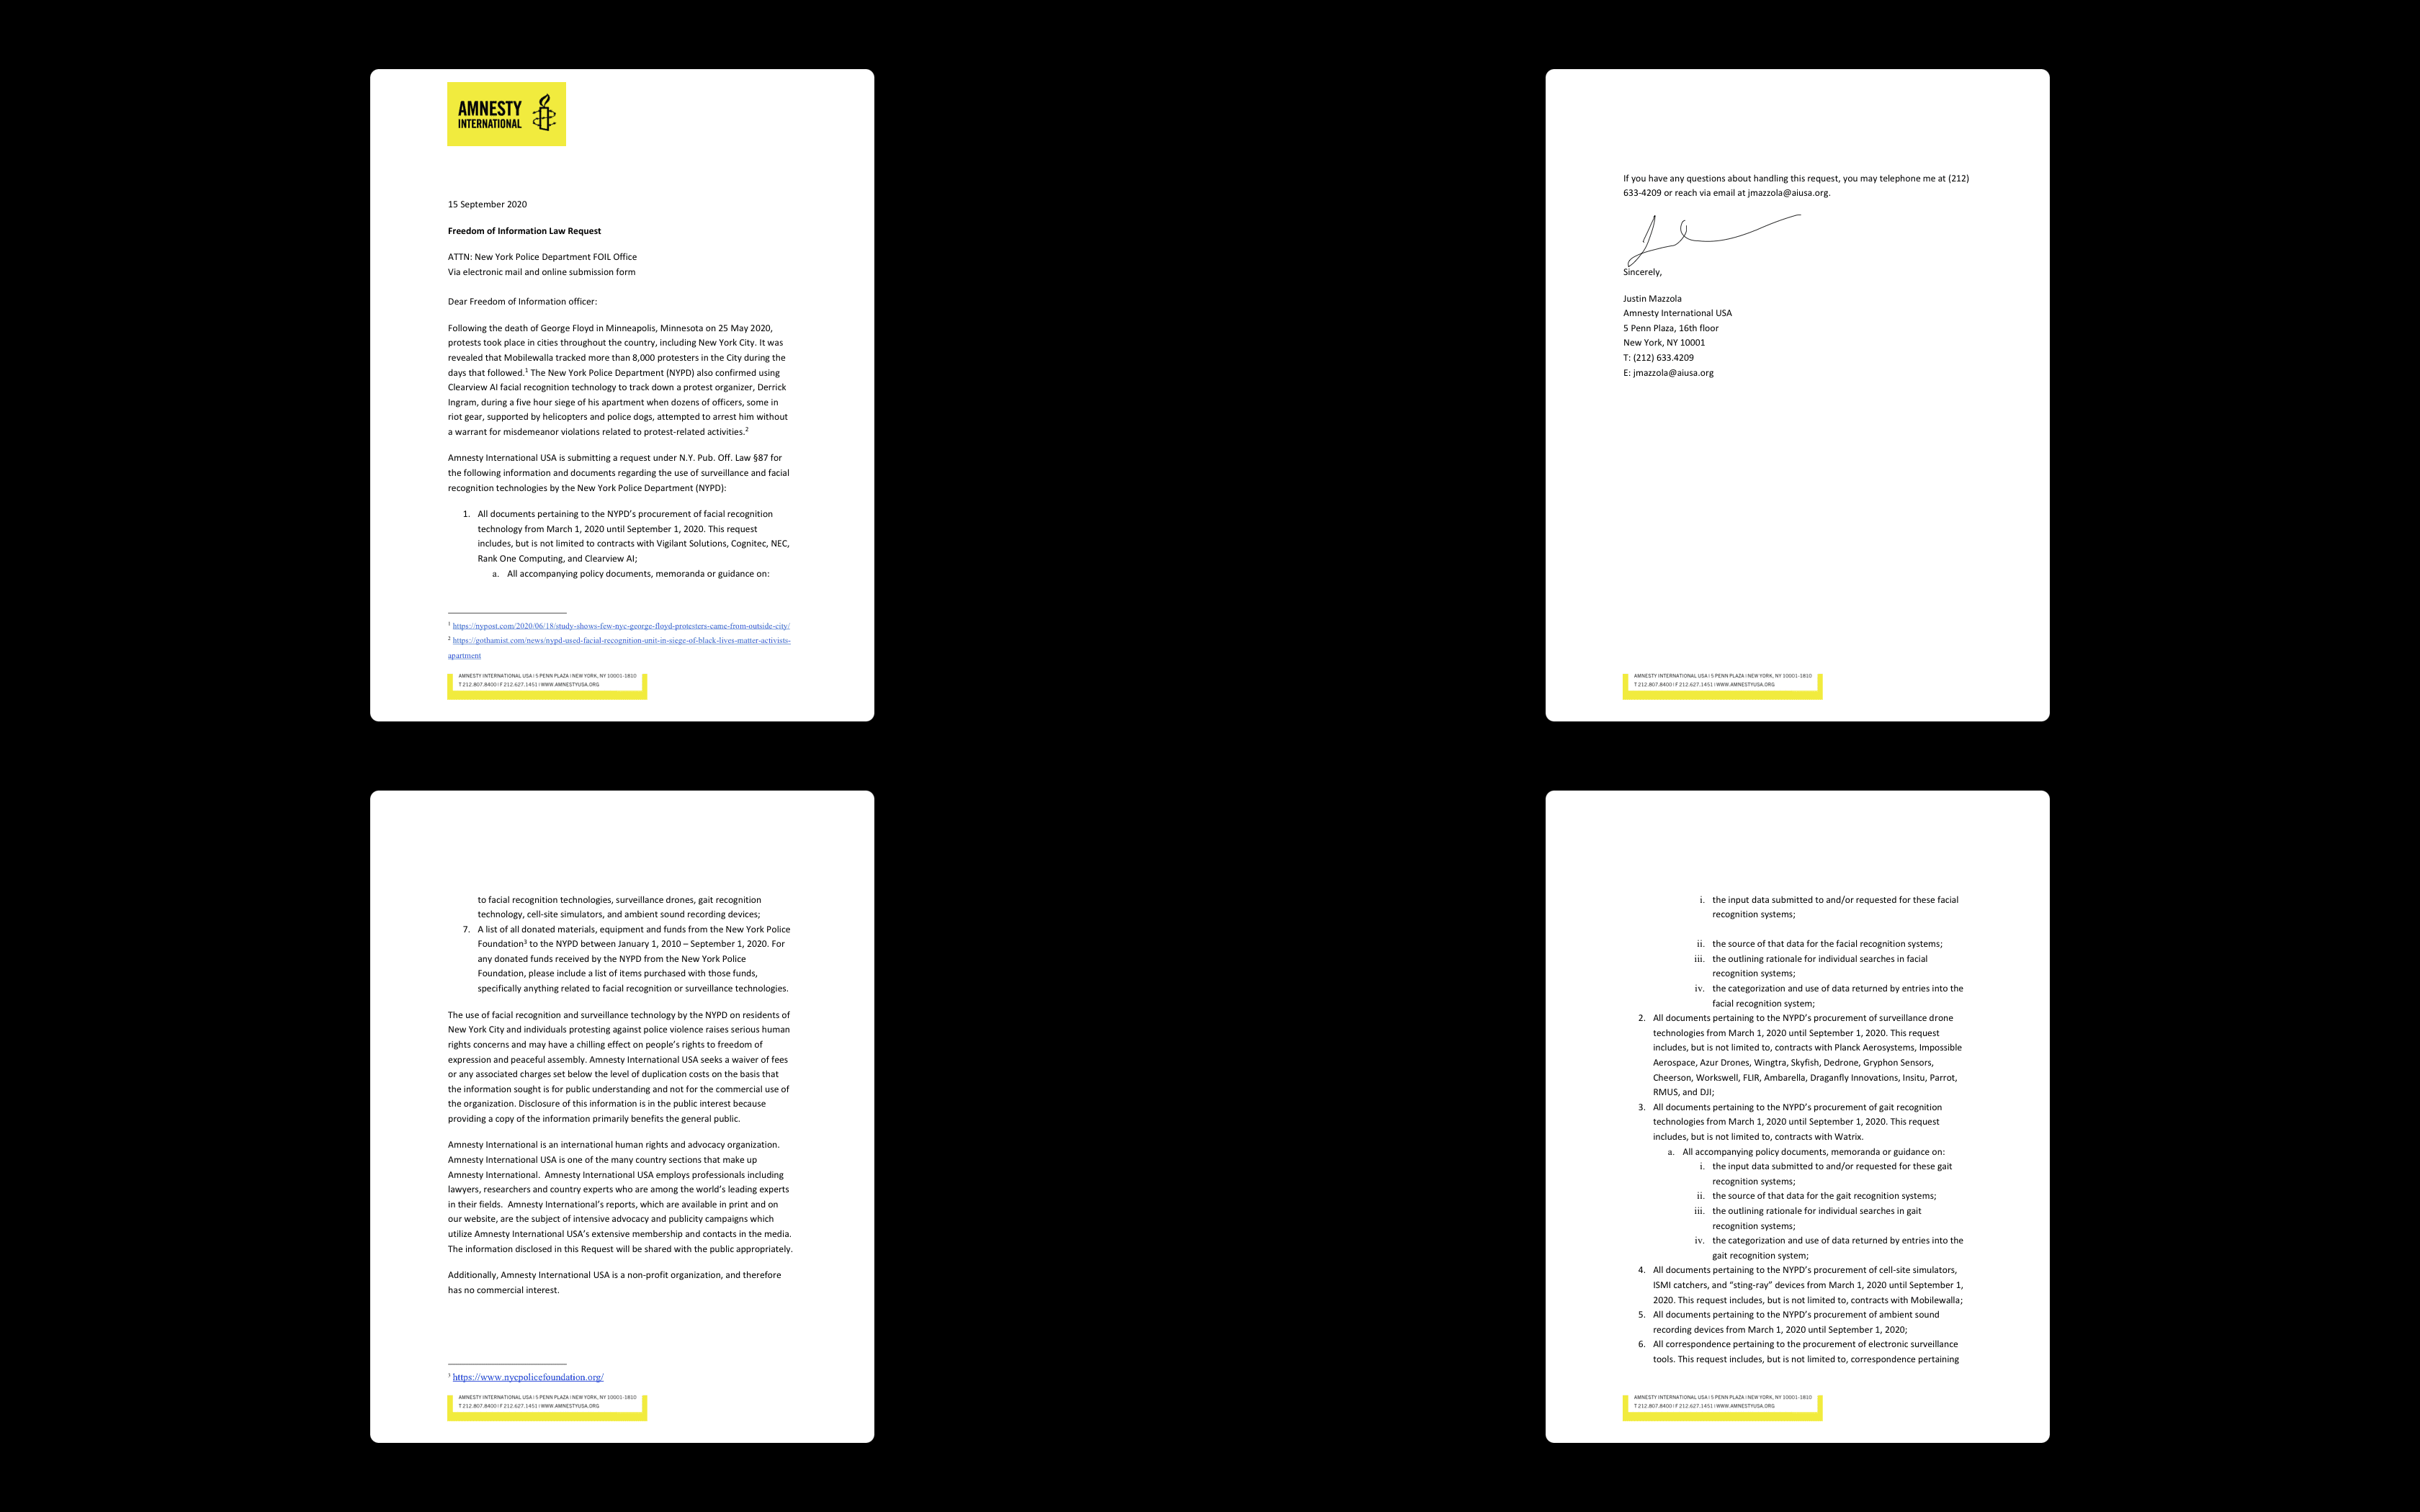
In September 2020, with help from New Yorkers and partner organizations in the Ban the Scan coalition, Amnesty International USA asked the New York City Police Department (NYPD) for documentation on its use of facial recognition technology (FRT). Citing that finding the information Amnesty was looking for would be tantamount to “looking for a needle in a haystack”, the NYPD declined our request and subsequent appeals.
Despite mounting evidence that the technology violates human rights, very little publicly available data on facial recognition exists, and this has become an obstacle to public oversight of the technology. At the same time, its application appears to be increasing. The NYPD used FRT in 22,000 cases between 2016 and 2019 — half of those were in 2019. In most cases, we do not know where, when, or why.
Citing that finding the information Amnesty was looking for would be tantamount to “looking for a needle in a haystack”, the NYPD declined our request
This is the problem that Mahmoudi brought to the Crisis Evidence Lab and Amnesty Decoders.
For the last five years, Amnesty Decoders has combined data-driven research with microtasking and participatory methods from citizen science. Decoders projects address large-scale problems often focusing on issues around data collection or data structuring. The new project we developed, Decode Surveillance NYC, centred on data collection.
Stories of how FRT threatens our right to freedom of peaceful assembly and expression are well documented. While the NYPD claims the technology is deployed to solve only the most serious crimes, news reports tell a different story of its use to prosecute minor offences, including in cases of graffiti or shoplifting. For example, in the summer of 2020, it was likely used to identify and track a participant at a Black Lives Matter protest, Derrick ‘Dwreck’ Ingram, who allegedly shouted into a police officer’s ear.
Beyond such stories, a public record of the NYPD’s use of FRT is what the Nigerian-American artist and researcher, Mimi Ọnụọha, might call a “missing dataset”. “‘Missing data sets’ are the blank spots that exist in spaces that are otherwise data-saturated,” explains Ọnụọha.¹ Whether the missing data is about healthcare or housing, too often minoritized groups are disproportionately disadvantaged by the knowledge gap it leaves.
In the case of FRT, its use by government agencies disproportionately impacts Black and Brown people because studies have shown they are at greater risk of being misidentified and so falsely arrested. Even when accurate, facial recognition can be harmful — law enforcement agencies with problematic records on racial discrimination, are able to use facial recognition software, perpetuating and entrenching these targeted practices. Black communities, in particular, are in harm’s way.
Situating and scoping the work
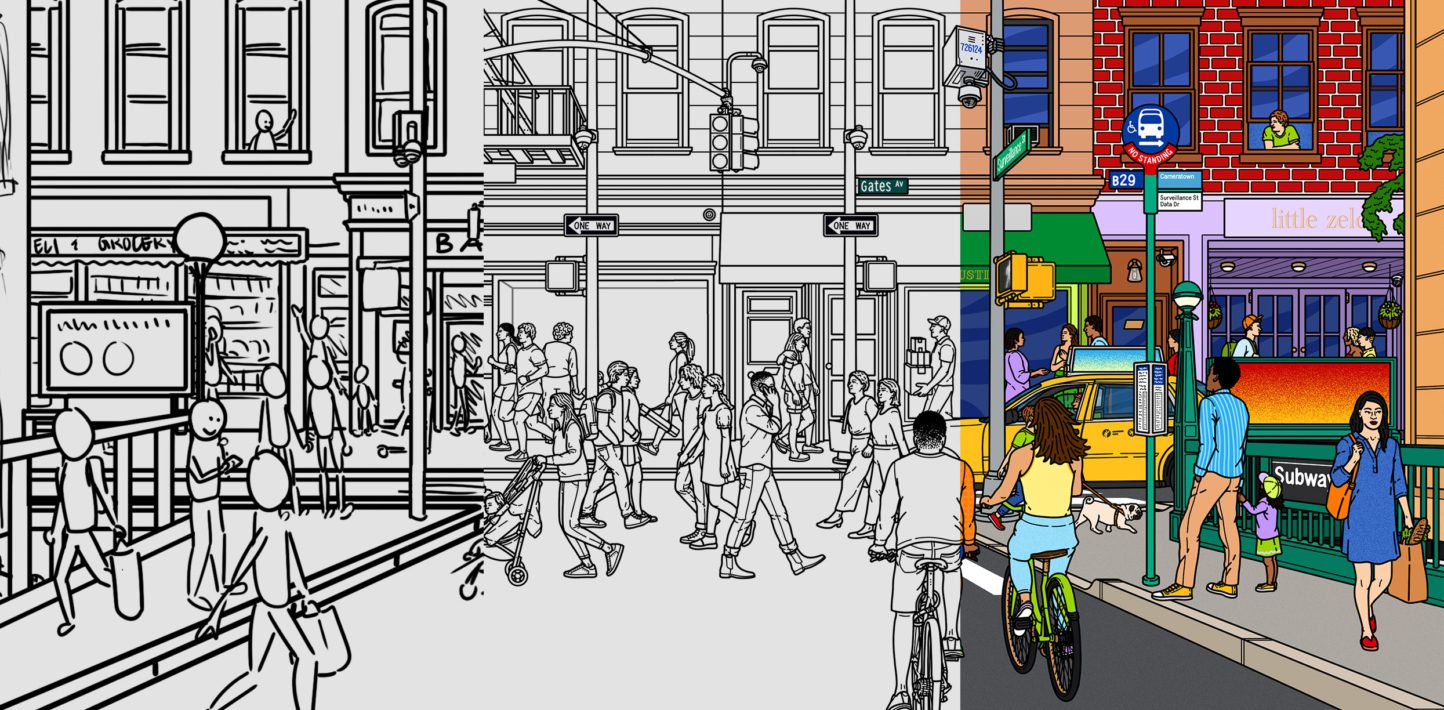
While we could not track uses of facial recognition software, what we could do was map the surveillance cameras that feed it. Critically, video footage from any camera, regardless of its age, can be fed into facial recognition software.
Before designing the methodology we scoped the research questions. We asked: What data on surveillance cameras was already in the public domain? Who has attempted camera surveys before and what we can learn from them? Has anyone attempted an online survey of surveillance cameras and if not, why not?
To help answer these questions, researcher Dr Victoria Tse joined the team to map existing projects in the USA.
To avoid duplicating existing contemporary data on camera location, Tse and the project team assessed commercial surveillance camera data, such as the locations of Link NYC kiosks, and open government data such as the Department of Transport camera locations.
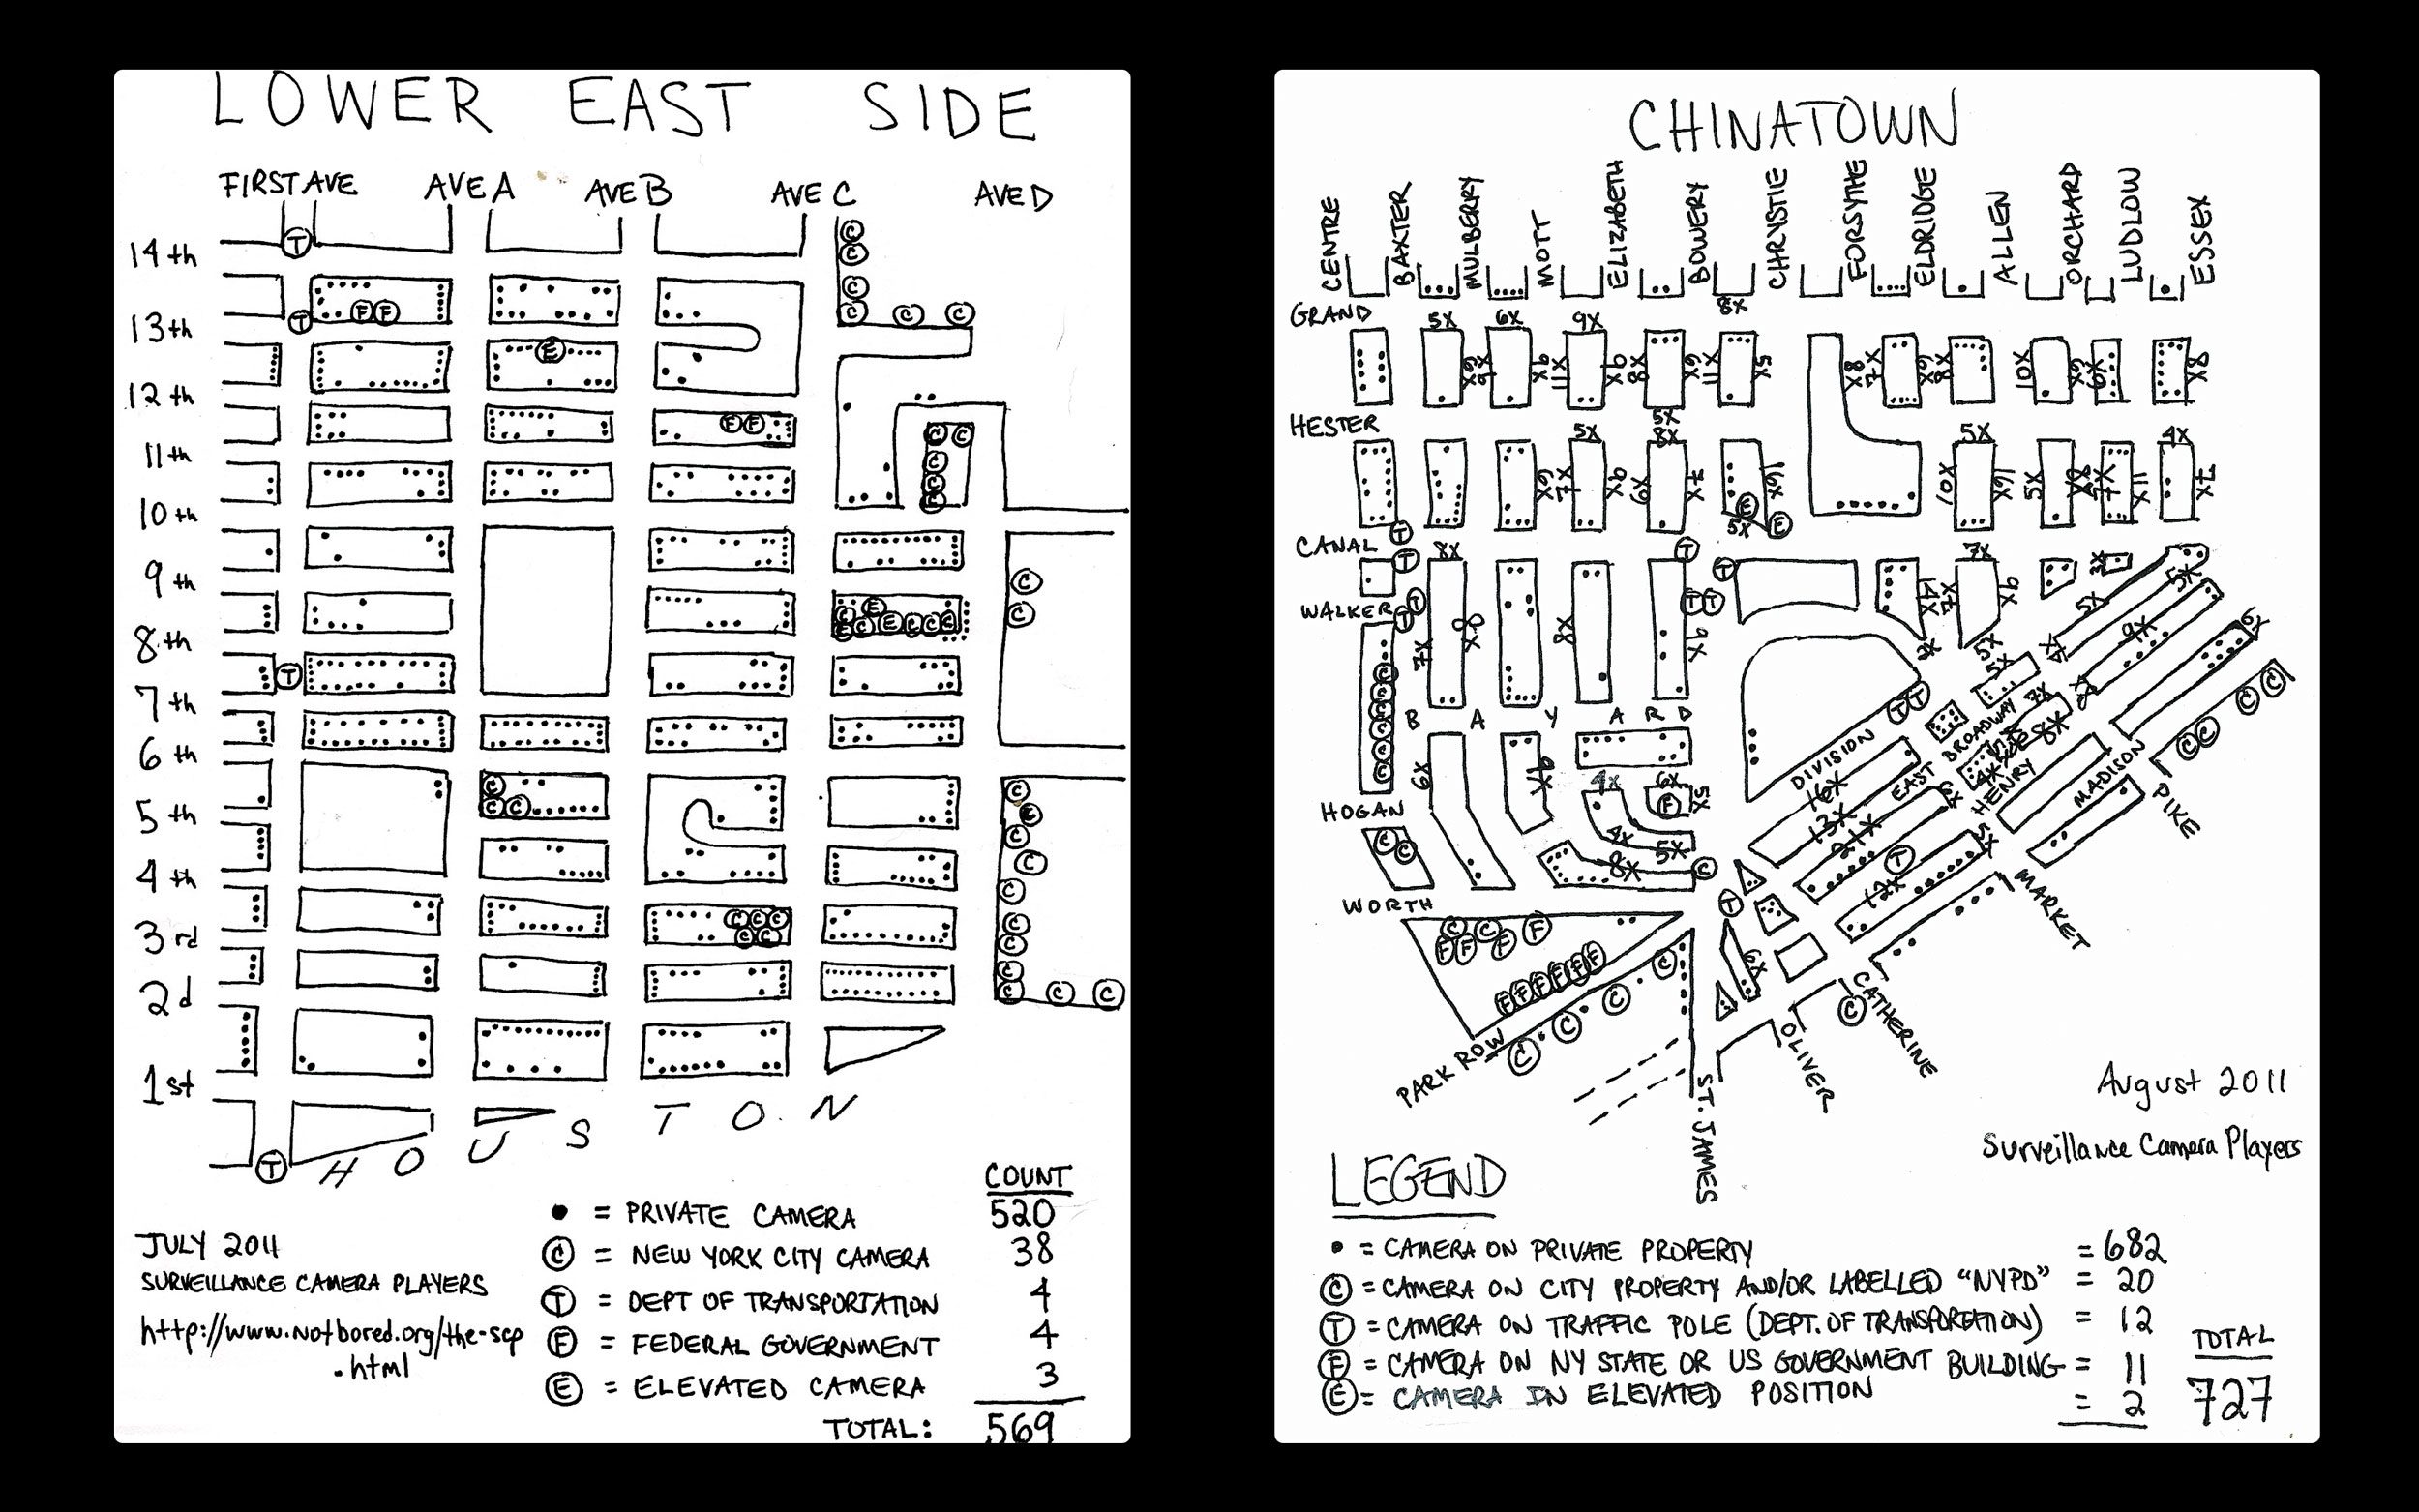
We also looked at historical data. The largest citizen-led survey of cameras, by far, was the 1998 NYC Surveillance Camera Project, and its 2006 follow-up, Who’s Watching. Both studies were conducted by the New York Civil Liberties Union (NYCLU) and used walking surveys.
Similarly, walking surveys were used by the Surveillance Camera Players, an artists’ collective that, in 2011, published a series of maps of New York City with hand-drawn locations of surveillance cameras.¹
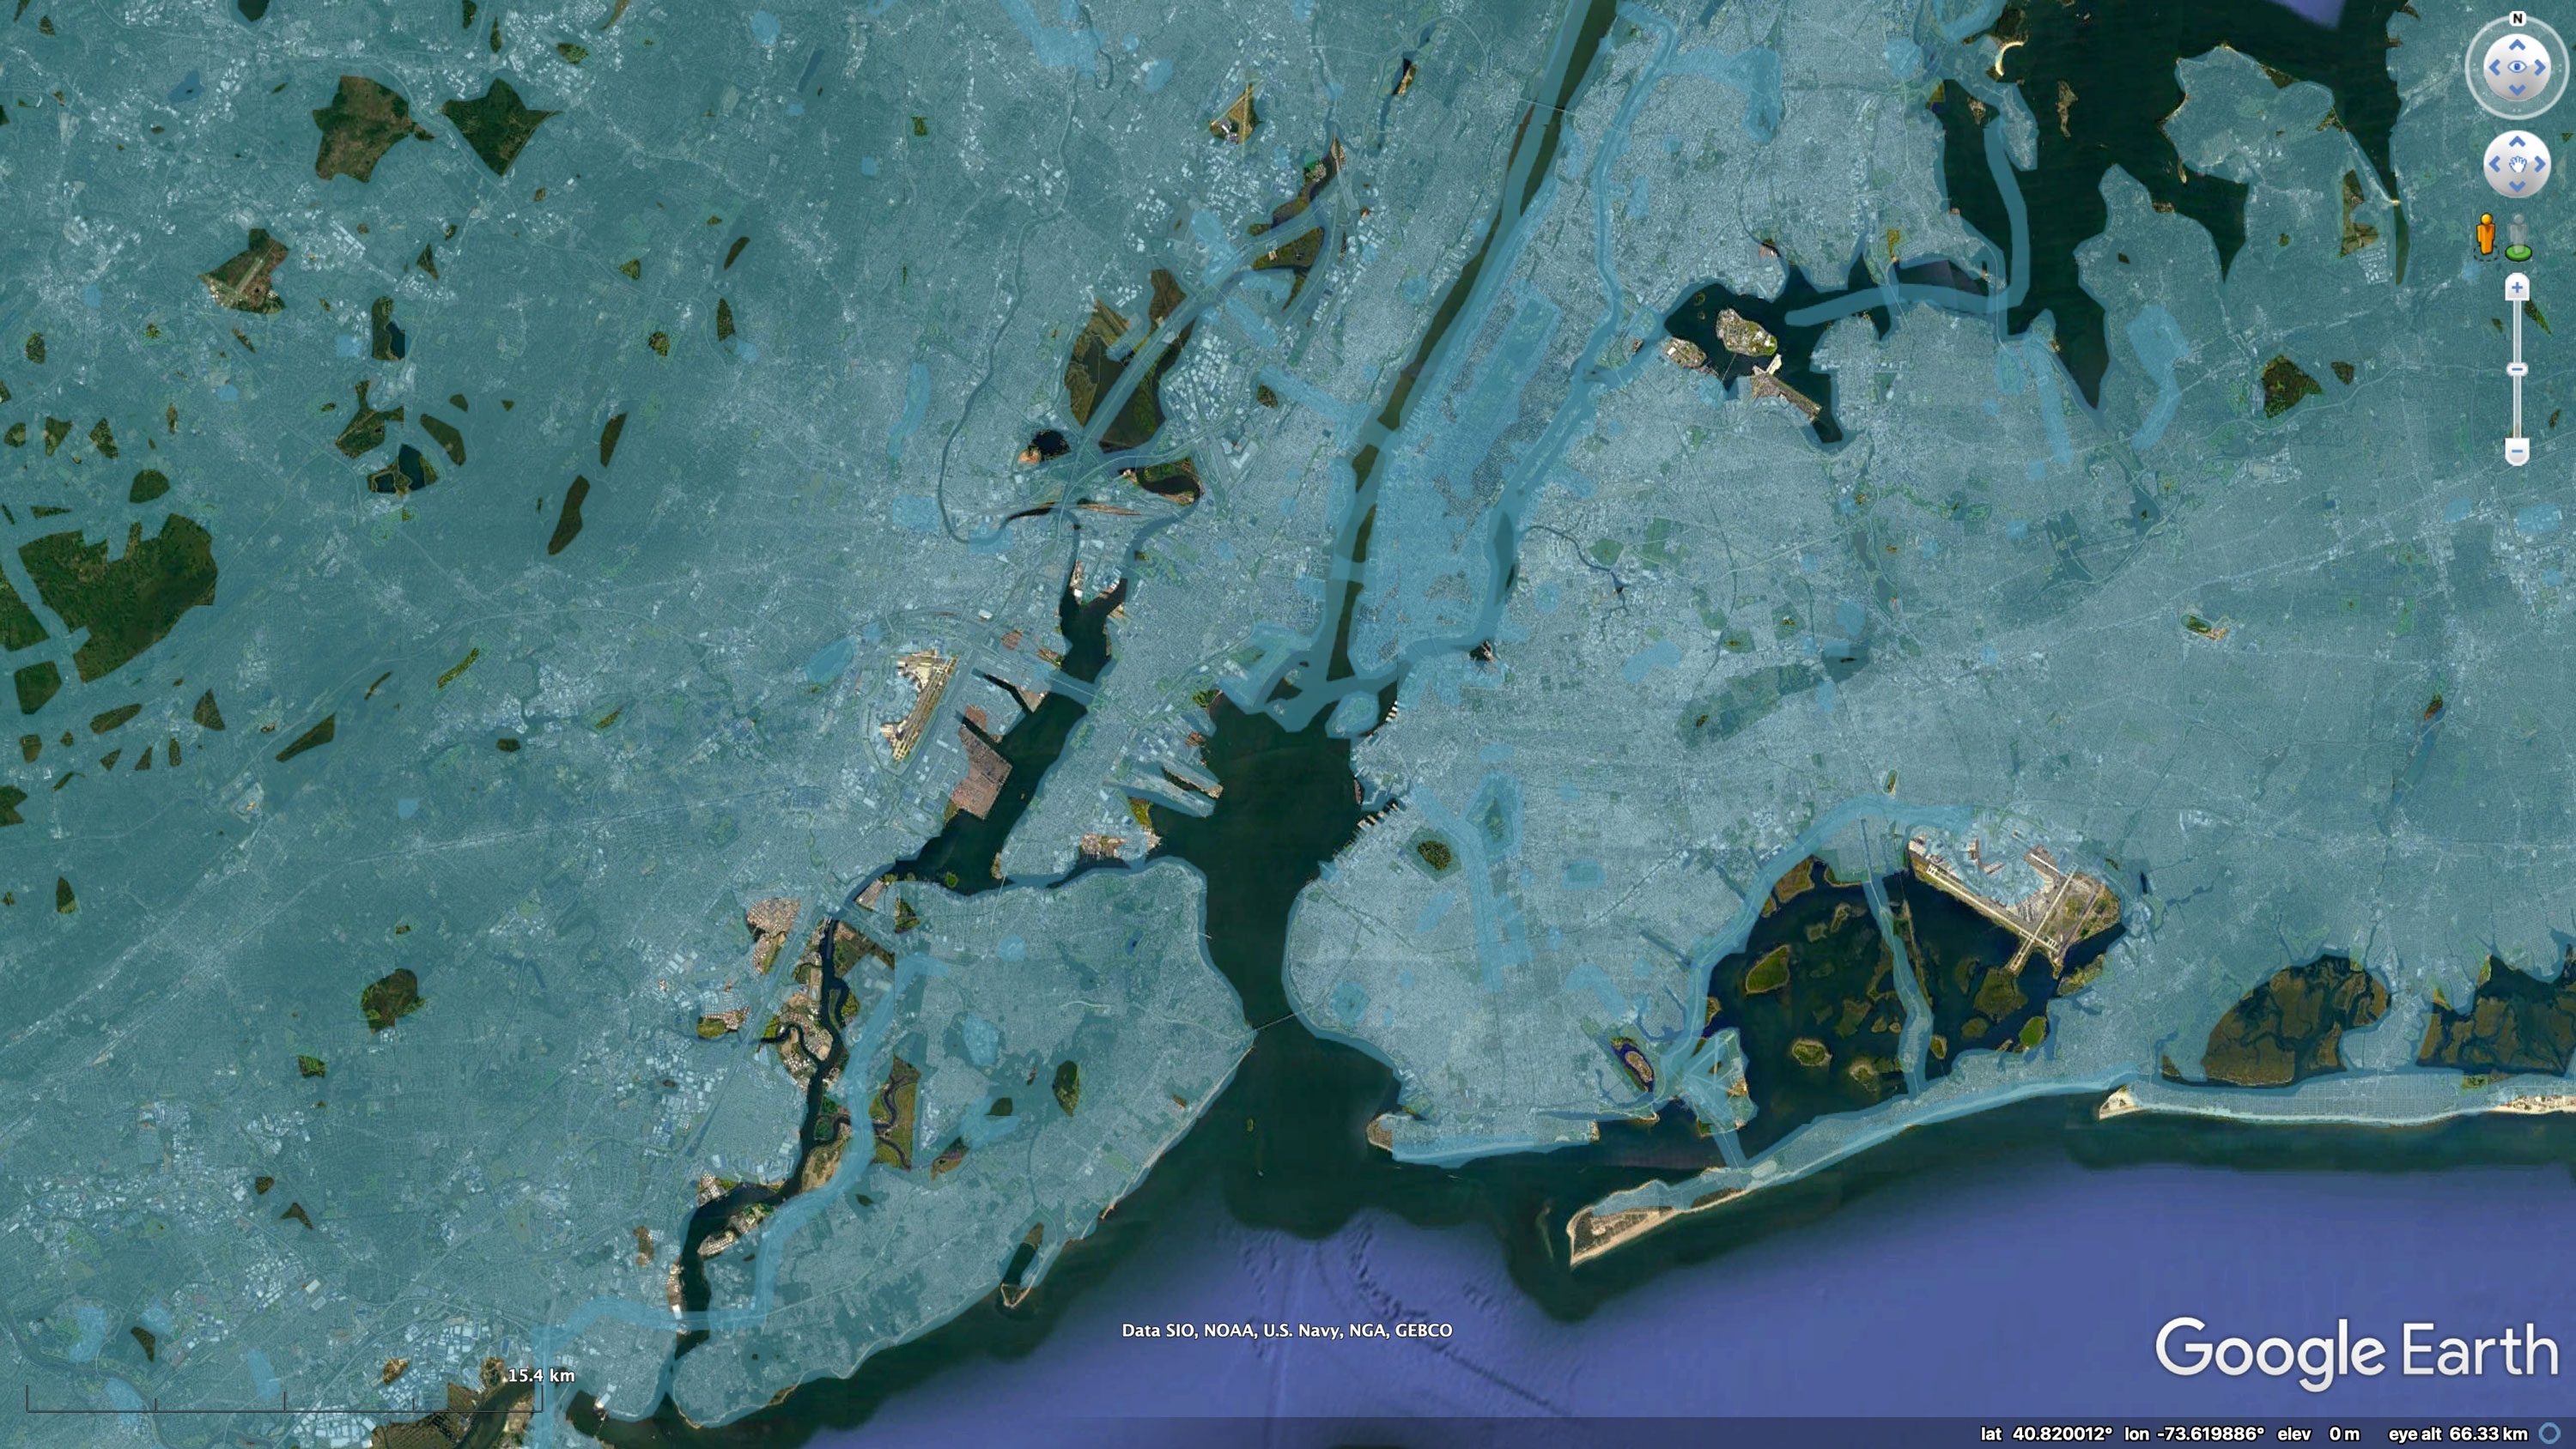
Inspired by the walking surveys, Amnesty Decoders used Google Street View’s API to take the methodology online — widening access to volunteers and allowing us to cover all of NYC.
Bing Streetside and the crowdsourced alternative, Mapillary, were also considered as possible image sources. However, only Google Street View had the geographic coverage and up to date imagery needed for the survey to produce meaningful results. Later analysis, conducted a month after Decode Surveillance NYC launched, found that 90% of Google Street View panoramas used in the project were taken in 2018 or later (82% were taken in 2019), while the earliest was taken in 2007.
Modelling threats to reduce risk
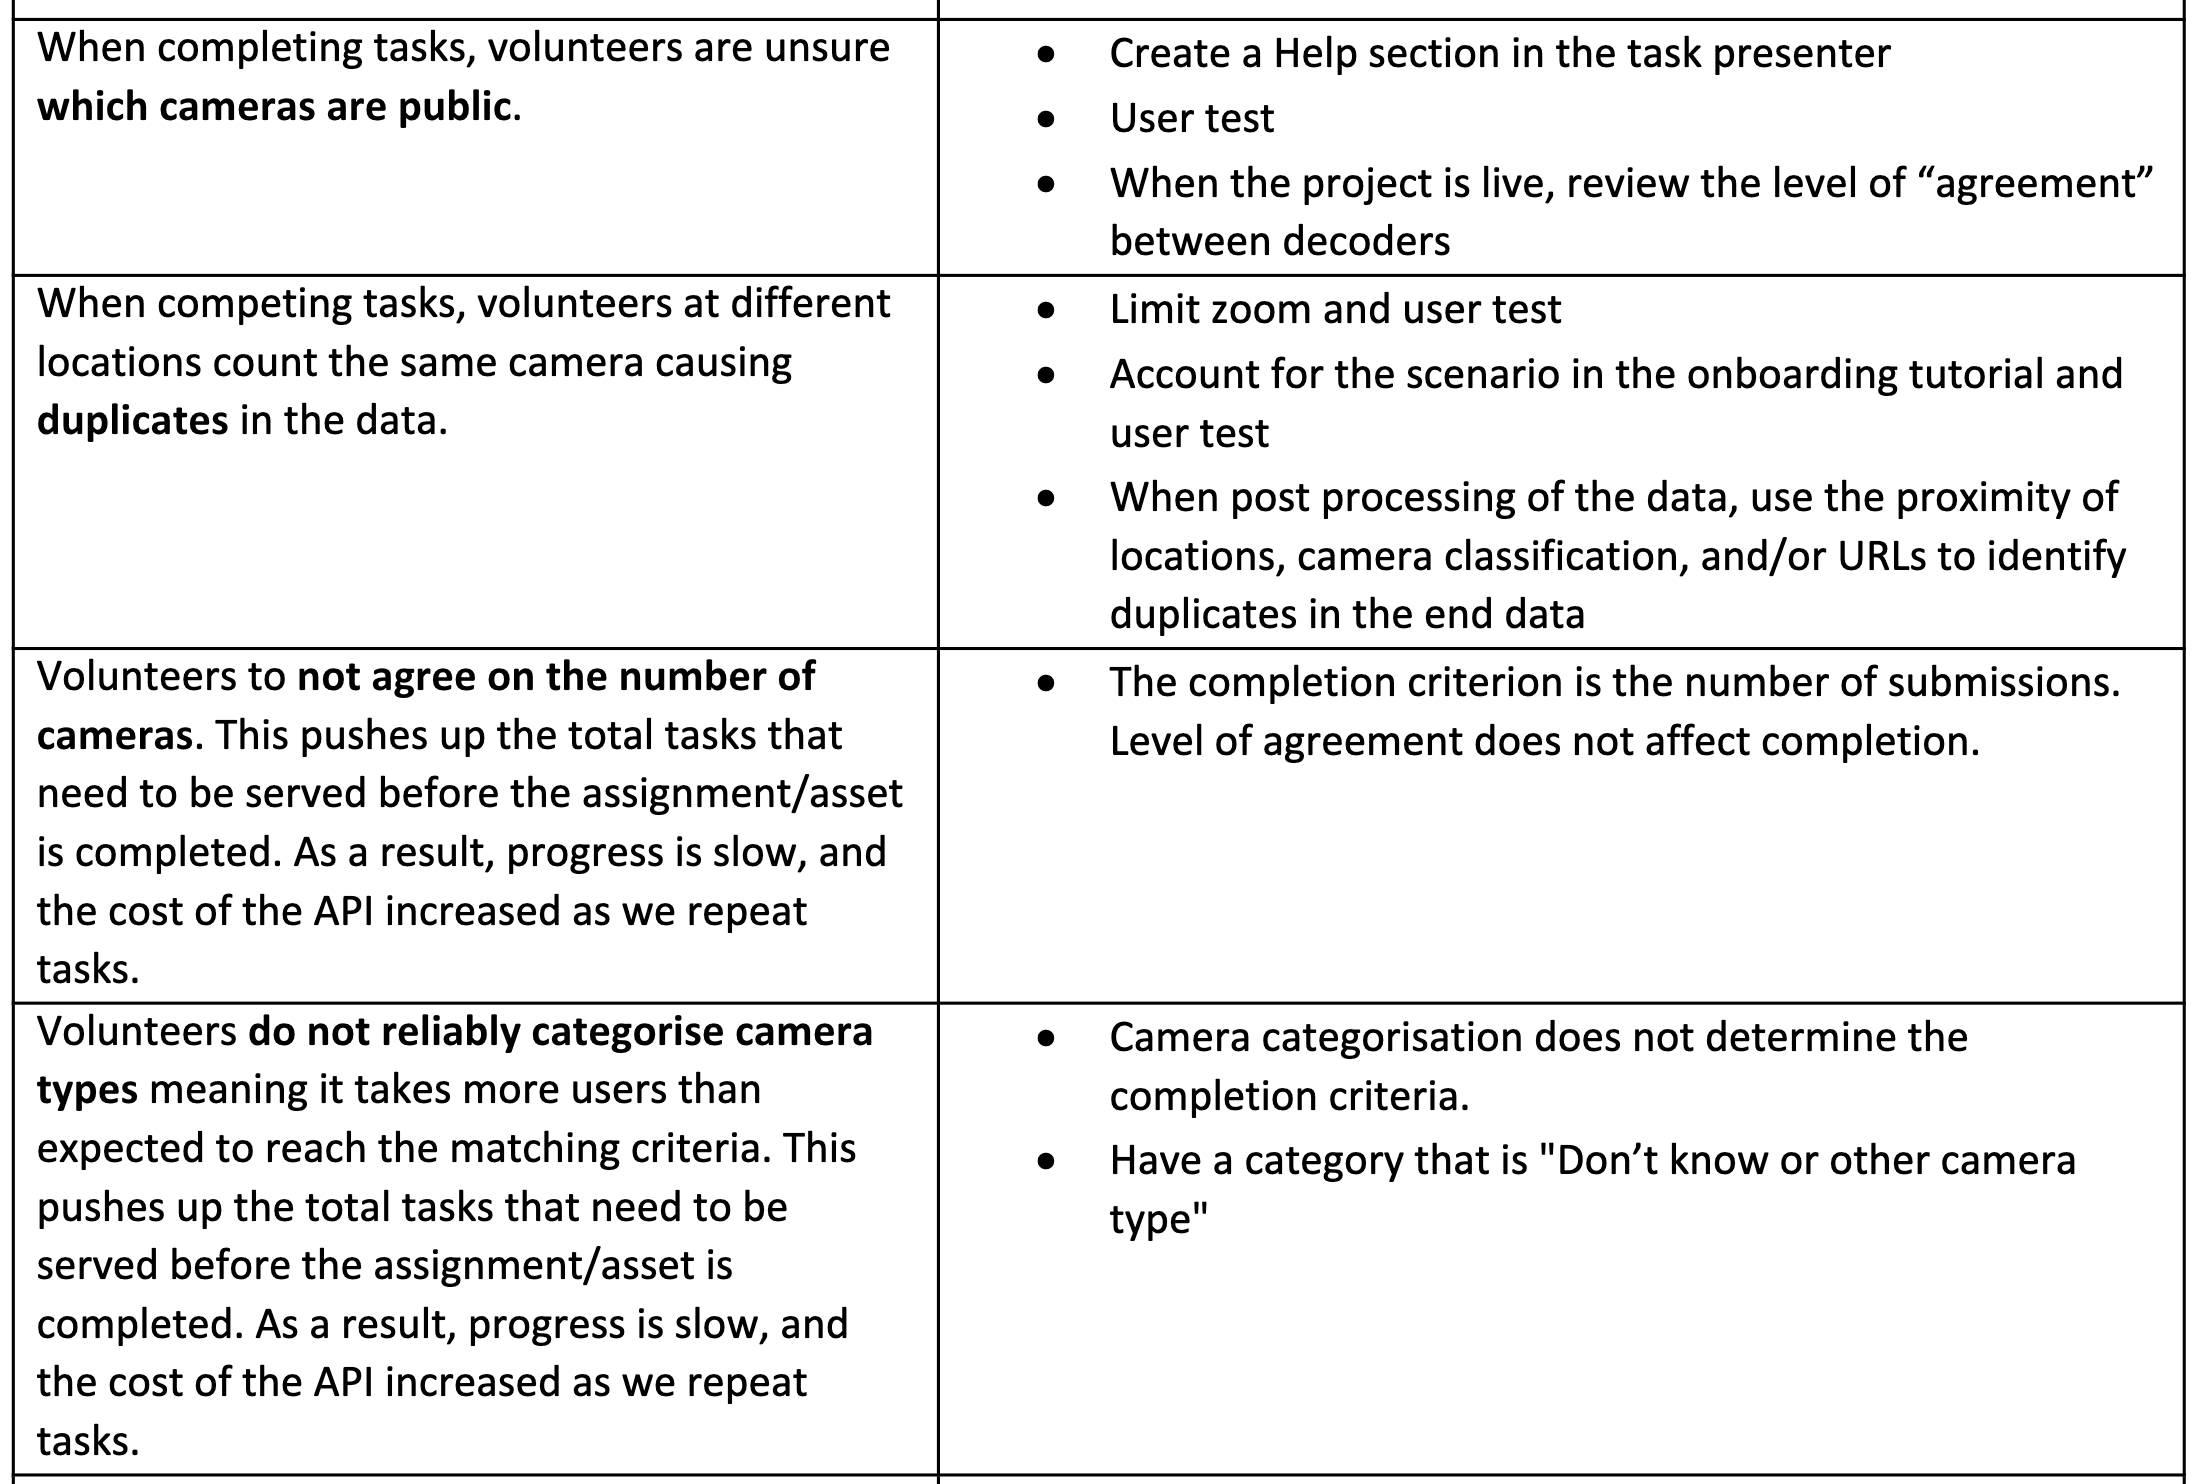
The novelty of the methodology and scale of the proposed research meant that the project carried significant risk. Two threat modelling workshops helped us tease out discrete risks and identify mitigation strategies. Below are notes from the section on volunteer-related risks, other areas included technical, legal, malicious actors, and privacy.
Unlike past Decoders projects, which stored the assets used for microtasking locally, Decode Surveillance NYC was reliant on paid access to Dynamic Street View API. To ensure we covered NYC within budget and to schedule, we decided to focus on the city’s more than 45K intersections where we suspected many publicly owned cameras would be located.
Developing the microtasking
While working remotely due to the pandemic the project team overcame significant challenges. When we realised that a complete and accurate dataset of every traffic intersection in New York City did not exist, fellow Evidence Lab colleague Micah Farfour, with help from David Blood, created a dataset using OpenStreetMap, GIS software, and elbow grease.
To design the microtasking, Amnesty worked with UX/UI designer David Acton who devised the user journey and designs. Acton’s designs were then put into code by the team at Xpon Technologies.
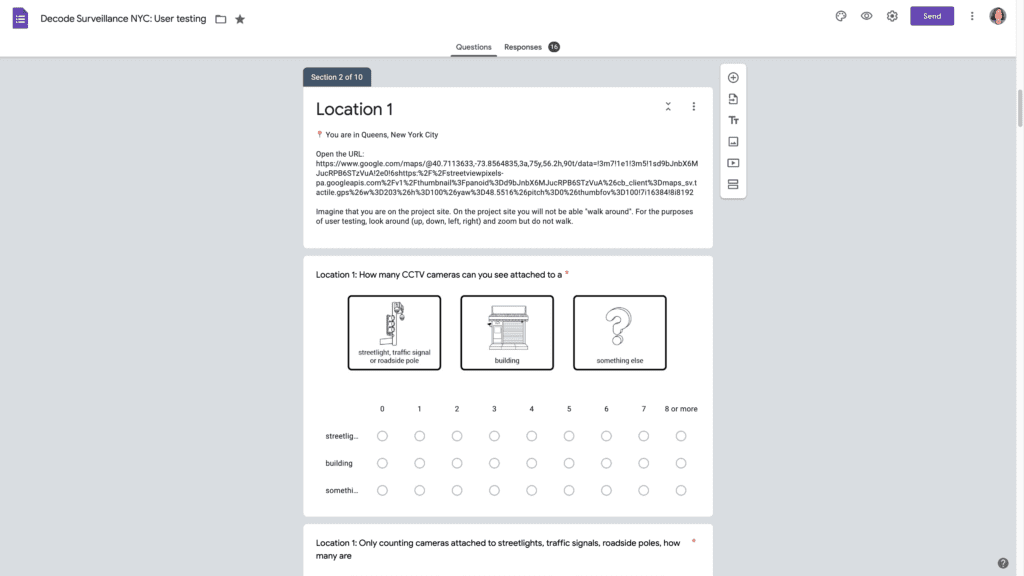
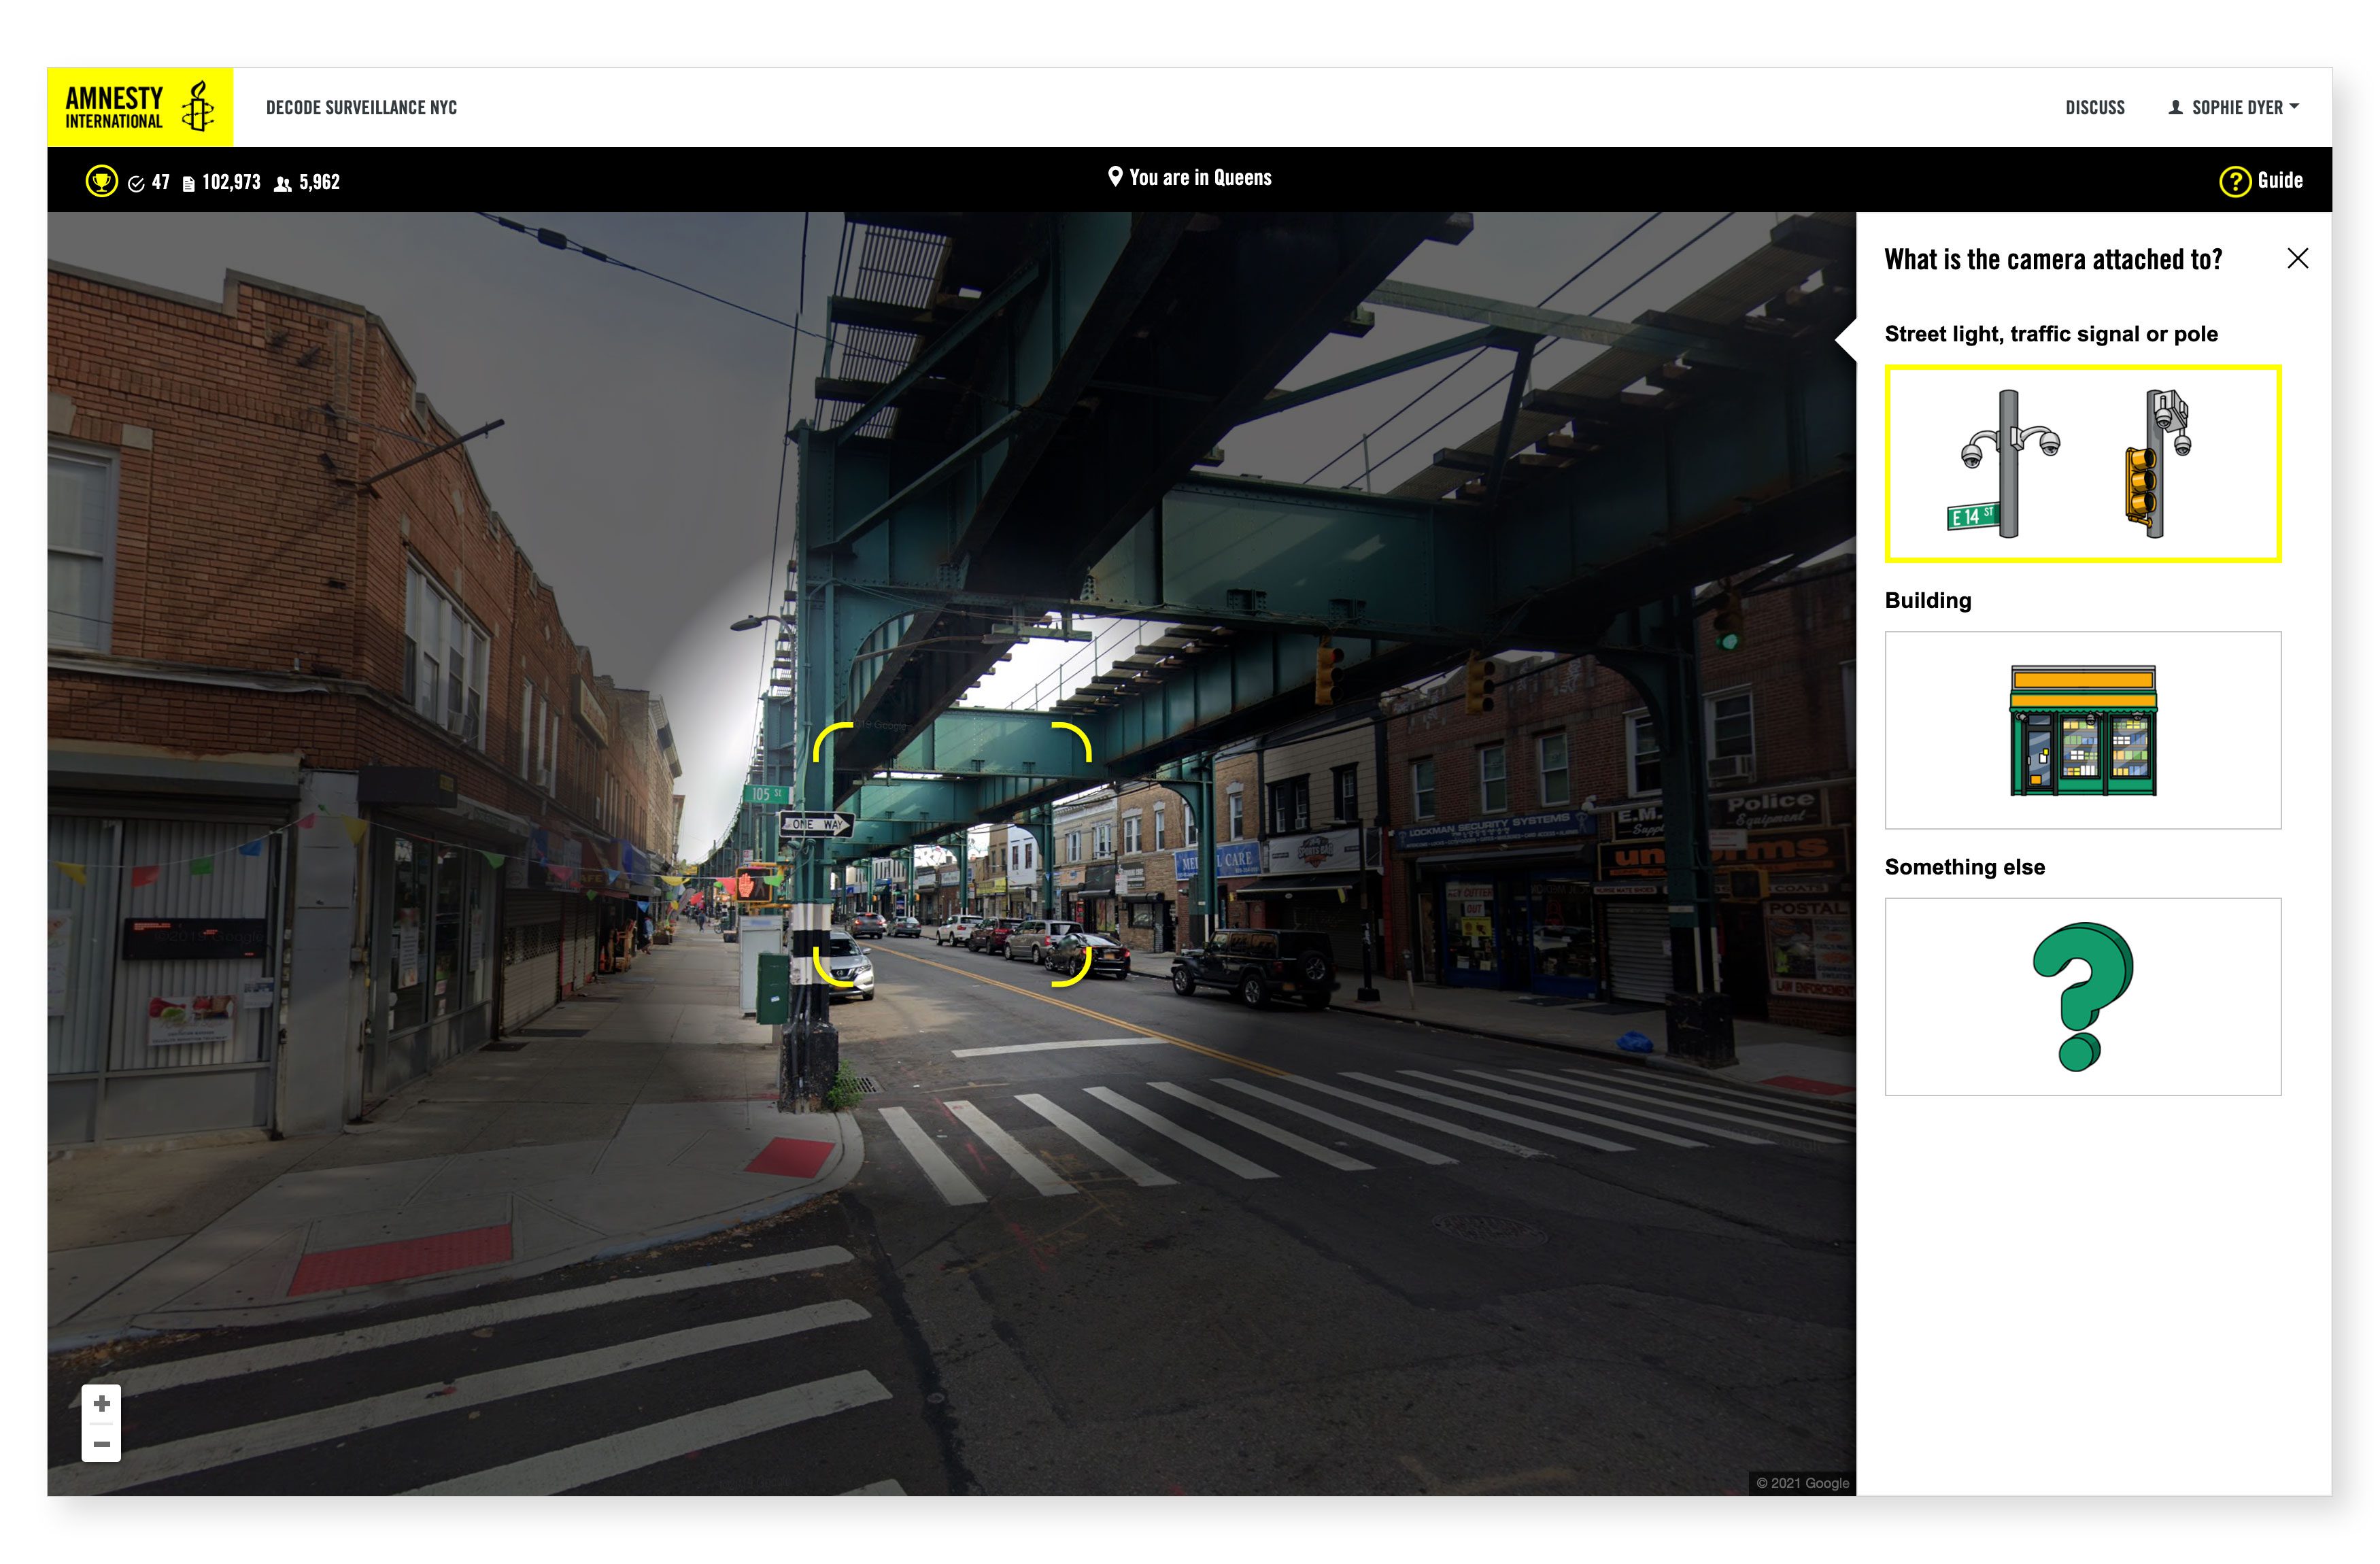
User testing steered many design decisions. Critically, it helped us identify which instructions volunteers would likely ignore, such as the command to only count cameras attached to street lights, traffic signals or other roadside poles. User testing revealed that, regardless of how this instruction was delivered, most volunteers counted all cameras including those on buildings.
As a team, we struggled with how to break down the data collection into effective microtasks. Although classifying cameras as publicly or privately owned was important for the wider campaign, this task wasn’t possible based on the available data on Google Street View panorama and the limits of microtasking.
User testing steered many design decisions. Critically, it helped us identify which instructions volunteers would likely ignore
In the workaround used in the final design, volunteers were asked to find all surveillance cameras and record what they were attached to. Three multiple choice options were given:
- Street light, traffic signal or pole
- Building
- Something else
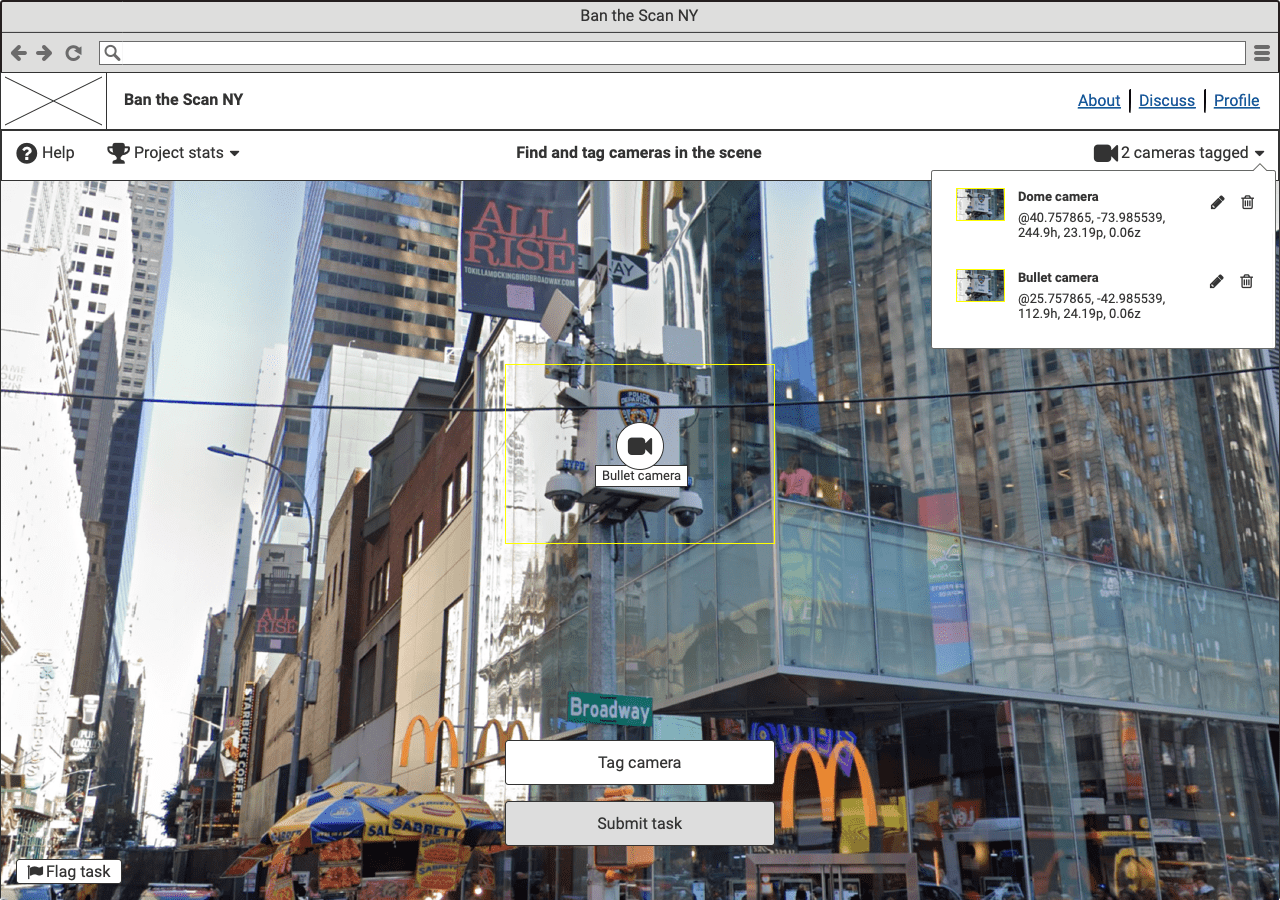
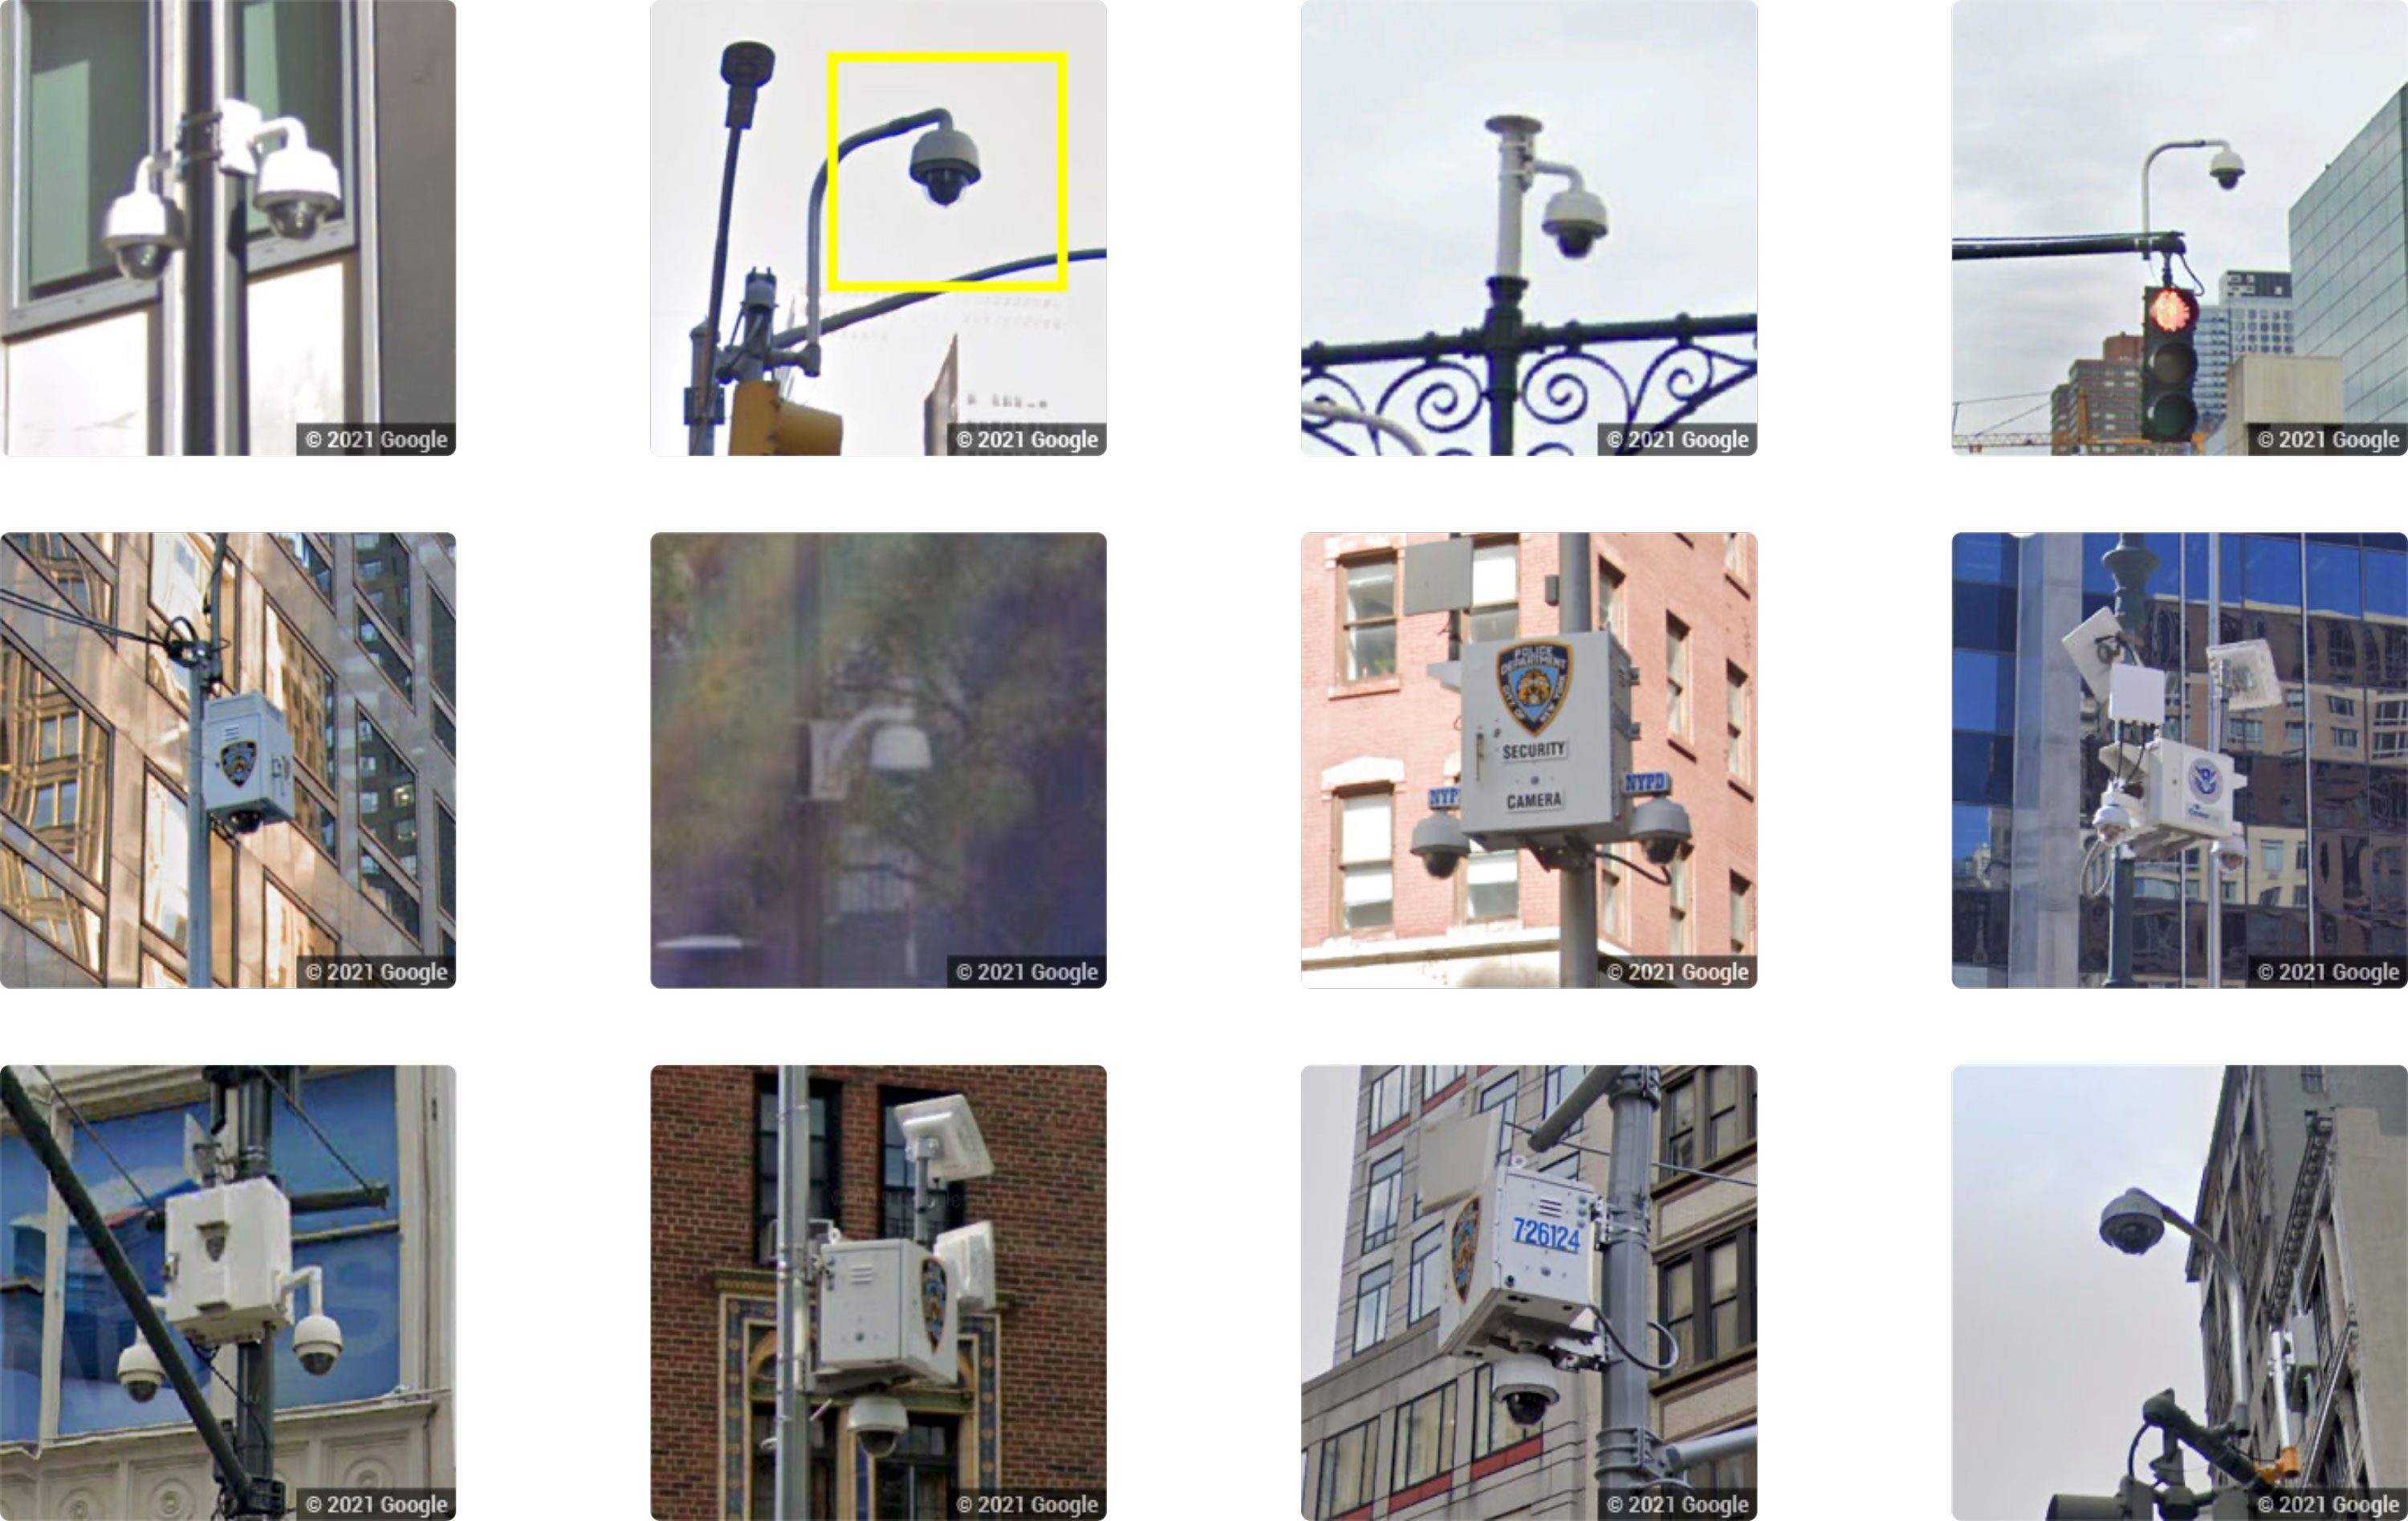
If volunteers selected option 1. “Street light, traffic signal or pole”, they were asked to identify the camera type. We chose three visually distinct, high-level categories:
- Dome or PTZ camera*
- Bullet camera
- Unknown or Other
*PTZ is an acronym for Pan Tilt Zoom
This information was then used as a proxy for public or private ownership. For example, cameras attached to traffic signals or street lights were assumed to be most likely owned by a government agency. In this sub-category, dome or PTZ cameras were of particular interest as they were likely to be NYPD Argus cameras. Whereas cameras attached to buildings were assumed to be privately owned and so of less relevance to the reseach, although we recognised that a minority would be attached to federal buildings.
The quality of the data collected rested on successfully onboarding a diverse cohort of volunteers, many lacking pre-existing knowledge of the subject. For the microtasking to produce reliable data we needed volunteers to give consistent answers or, to put it another way, agree with each other the majority of the time.
The multiple-choice questions were illustrated by pictograms drawn by illustrator Eliana Rogers. Rogers’ illustrations were used throughout the project site to reinforce instructions, and as visual aids for volunteers who were not fluent in English or would otherwise benefit.
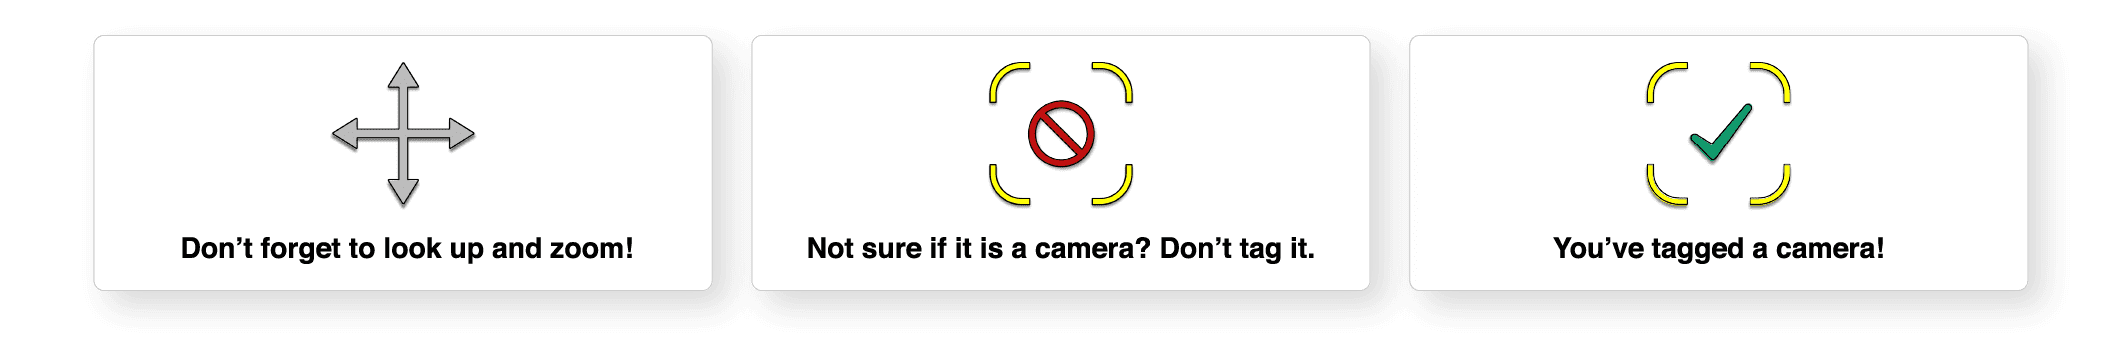
In addition, a tutorial video filmed on location, a visual Help Guide, and a moderated forum ensured that volunteers could access support at every stage of the microtasking. For the first 20 tasks, occasional pop-up notifications such as, “Don’t forget to look up and zoom in” and “Not sure if it is a camera? Don’t tag it” repeated tips from the tutorial video.
In this post, we aimed to share some of the underlying research and rationale that shaped Decode Surveillance NYC, as well as demonstrate how reliant the project is on interdisciplinary teamwork.
In the next post in this series, we will depart from the design of the data collection, to discuss the data science and 3D modeling work that was conducted during the first weeks the project was live, and that informed the June 2021 press release.
For an insight into our UX/UI design process see: Designing Amnesty Decoders: How We Design Data-Driven Research Project
¹ mimionuoha.com/the-library-of-missing-datasets