
In this three-part series, we focus on key elements behind the successful crowd-sourcing project, Decode Surveillance NYC, including the design of the data collection, early analysis, and what it means to build community online.
In part two, the authors discuss the data science and 3D modeling that was conducted during the first weeks the project was live, and that informed the June 2021 press release, ‘Surveillance City: NYPD can use more than 15,000 cameras to track people using facial recognition in Manhattan, Bronx and Brooklyn’. In particular, three goals:
- Quality check and aggregate: How much can we trust the data, and what is it telling us? Data science led by Julien Cornebise and Swetha Pillai.
- Visualize: How can we present this data so it is legible to the largest possible audience? Data visualization led by David Blood.
- Contextualize: How do we answer the new questions this data raises, by grounding ourselves in the physical reality of the streets and the camera lenses? 3D modelling led by Martyna Marciniak.
As Product Manager, Sophie Dyer, worked to coordinate and weave together the three strands of analysis.
Throughout this post, we refer to a snapshot of the data taken on 19 May 2021 that was published in the June press release, and included Manhattan, Brooklyn, and the Bronx: almost half of all the intersections in New York City (NYC).
Constructive disagreements
How often did volunteers disagree?
We designed the study so each intersection would be analyzed by three volunteers. This redundancy allows for quality checks and robustness. In lab conditions, our instructions would be clear, the Google Street View images unambiguous, and each decoder would have a large high-contrast 45″ computer screen and identical eyesight. We could then dream of perfect agreement amongst all three decoders at each intersection. Of course, such a scenario is unreal – this is why statistics exist.
If a decoder was unsure, the tutorial video and the help guide instructed them to be cautious and: “if in doubt, do not tag!”. In statistical terms, this favours minimizing type I error (false positive) at the price of possibly increased type II error (false negative); or in machine learning terms, this favours precision over recall. Volunteers were also encouraged to flag tasks for discussion in the forum but, to ensure independent answers, could only do so after submitting the task. A separate system allowed volunteers to report Street View errors to project administrators, such as “I am not at an intersection” or “No image”.
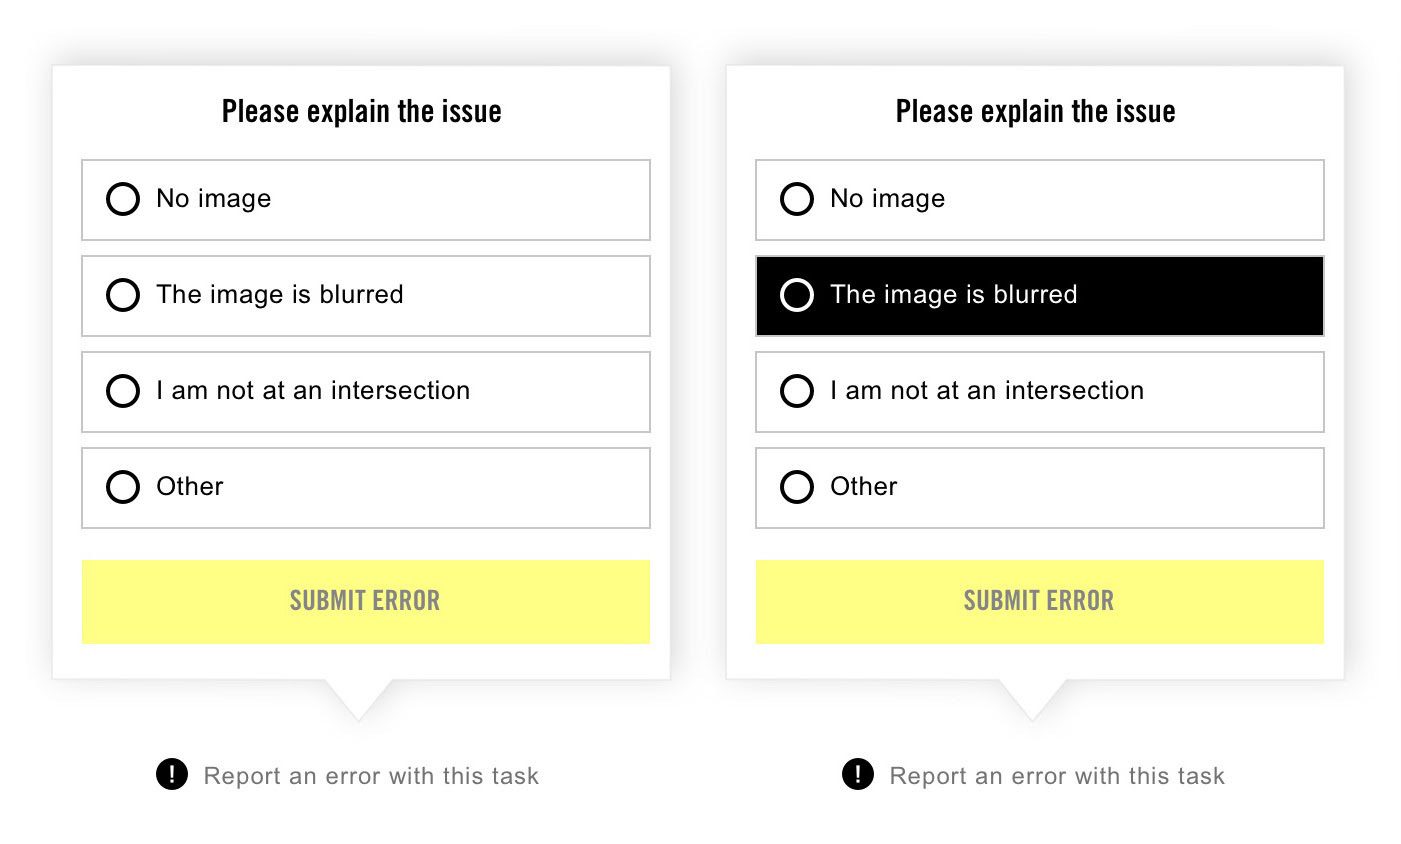
The options given to volunteers when selected “Report an error”. Source: Amnesty International
So, how often do three decoders make the same observation at an intersection? Looking at the count of public cameras overall intersections investigated (18,641) so far, in Chart 1, we have full agreement amongst the volunteers for about 75% of the intersections in Manhattan, Brooklyn, and the Bronx: all three decoders gave the same one observation (regardless of what that observation is). The other 25% of the time, however, our three decoders gave two or even, rarely, three different counts.
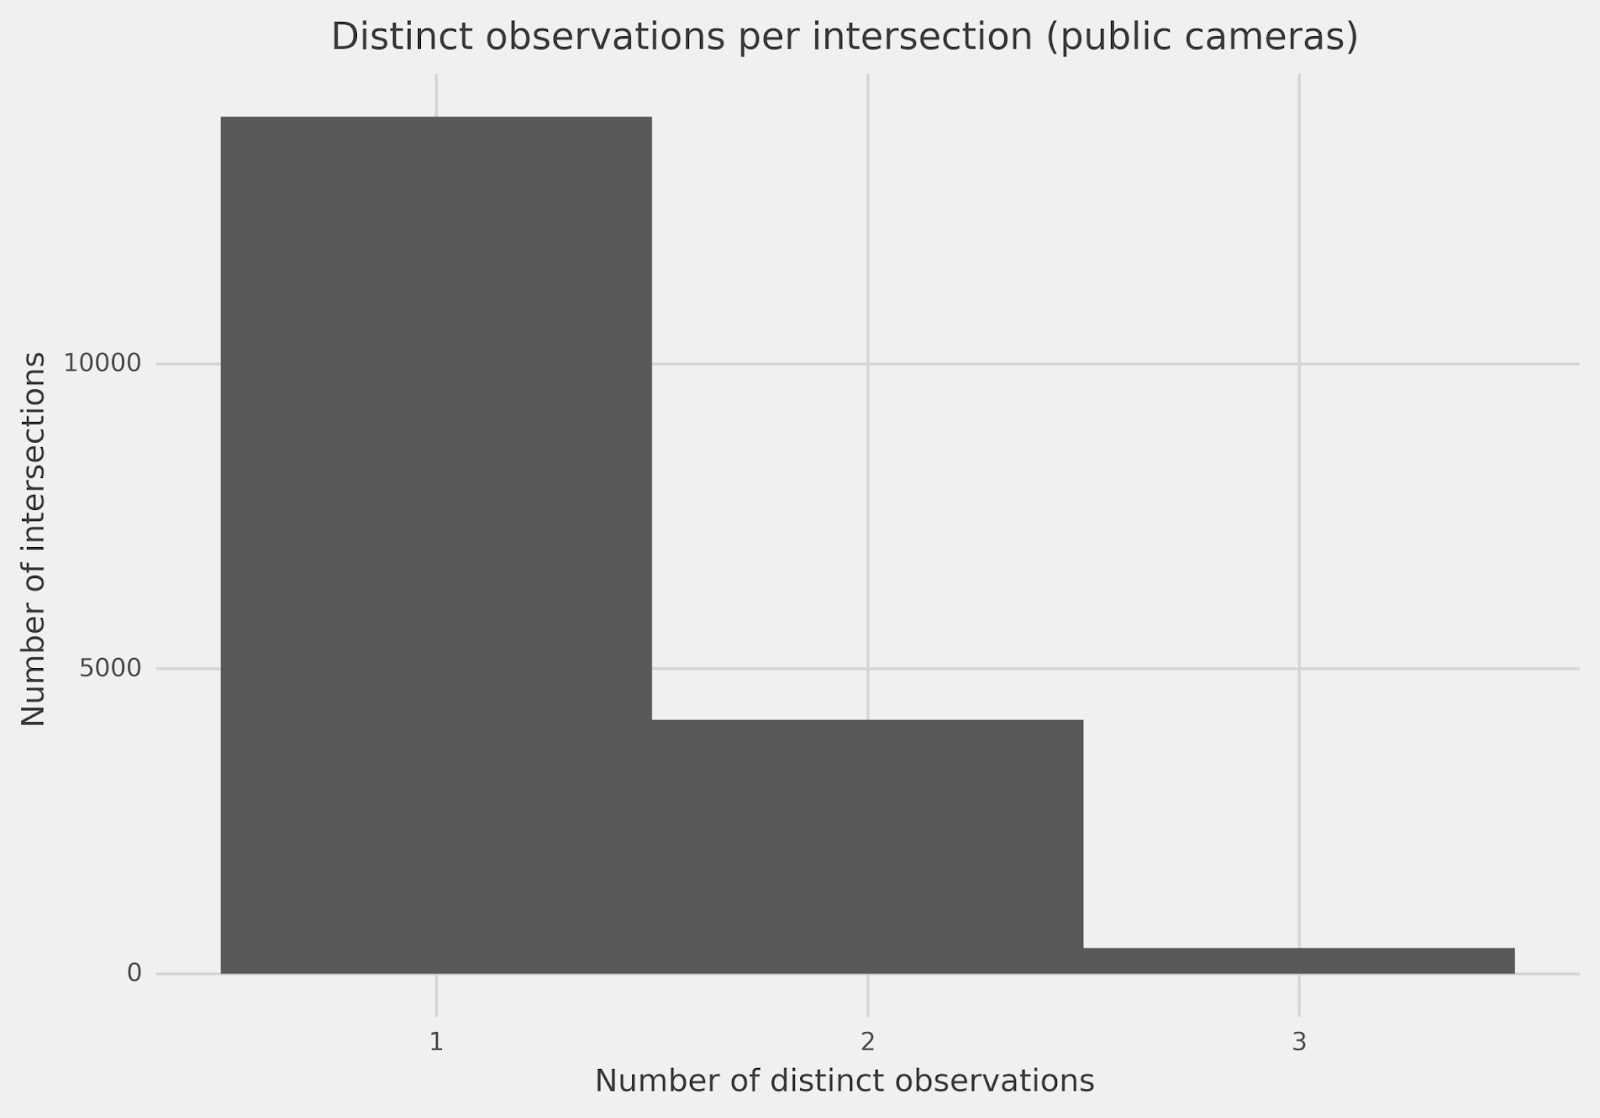
Chart 1: How often do we have agreement amongst the three decoders for public cameras over all intersections? Three distinct observations mean each decoder gave a different count. Two distinct observations means two decoders agreed and the third disagreed. One single distinct observation means all three decoders agreed. Source: Amnesty International
This disagreement tells us that decoders most often agree unanimously – which is a very good sign. Yet to trust our data, we need to understand when and why they disagree. And before answering any questions, we need to decide how to aggregate the answers from each triplet of decoders.
Take the middle one
For the June press release, we used the median of the three decoders’ camera counts at each intersection. Informally, the median is the “middle one” of the three values. It is known to be more robust to outliers and individual errors than averaging: on any intersection, if two of the three decoders correctly count the cameras, but one mistakenly tagged too many or too few, the median would not be influenced by that one extreme. It also provides a meaningful tiebreaker in case of full disagreement, leveraging the proverbial “wisdom of the crowd”.
This allowed us to move on to finer-grained checks. We grouped intersections by their median: all intersections having a median of no cameras, a median of one camera, a median of two cameras, etc. While not a perfect grouping (the grouping depends on a metric which itself depends on the disagreement), it was sufficient for early analysis.
For each such group, we investigated how often the decoders disagreed, and by how much. Chart 2 shows how often we have full agreement amongst three decoders (leftmost bar), or two-versus-one (middle bar), or three decoders each giving a different count (rightmost bar). Chart 3 shows how far are the largest and smallest of the three counts.
Both tell the same story: the higher the camera count, the less volunteers agree, i.e. the error margin will grow with the number of cameras. This makes sense: the more cameras, the more chances of missing one. The groups of intersections with the least agreement are also the rarest ones: very few intersections are found to have five or more cameras (see Y-axis).
Most importantly, the charts indicate that not just overall, but also across all significant groups of intersections, decoders agree much more than they disagree. This was reassuring, confirming that in spite of Decode Surveillance NYC being one of the most complex task in the history of the Amnesty Decoders, our volunteer decoders continue to deliver consistent data.
Yet thoroughness requires that we dig deeper into the disagreements that do exist.
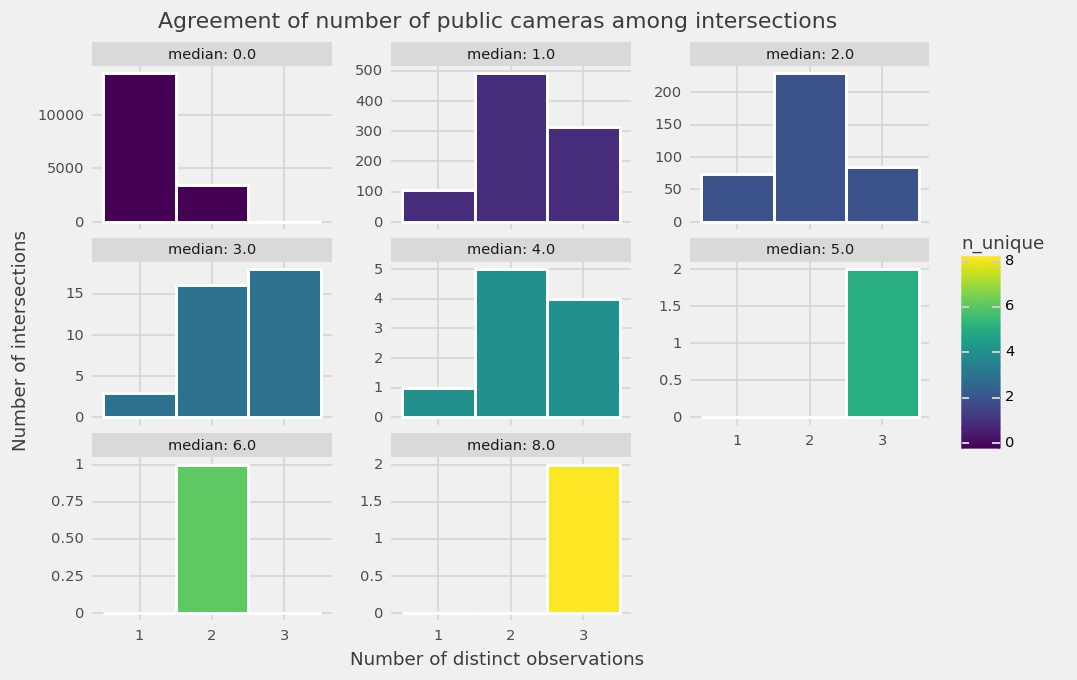
Chart 2: Distribution of agreement amongst decoders’ public camera count at intersections split with respect to its median number of public cameras. Source: Amnesty International
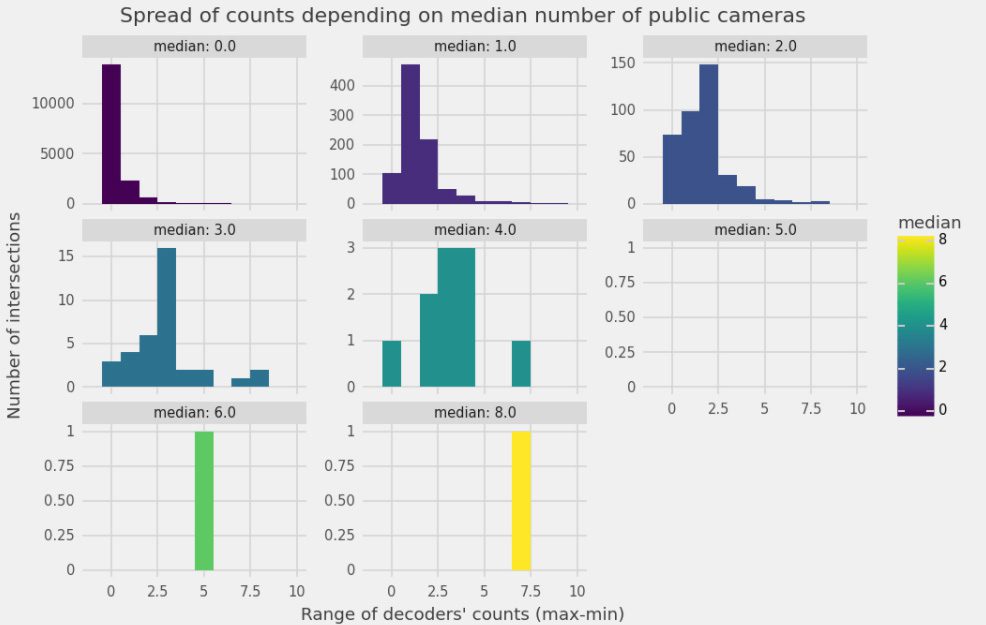
Chart 3: Spread of public camera counts amongst intersections of the same median public camera count. Source: Amnesty International
Behind the data points: What kind of disagreement?
Before publishing, the team checked the data for cases where the median retained or amplified errors. We conducted a qualitative review, and a quantitative review is ongoing.
First, the qualitative review consisted of eyeballing the disagreements to understand their type. We sampled 100 intersections, heavily biased towards disagreements to cover a broad range of extreme cases. Team member and geographer, Sofia Caferri, then reviewed these intersections, looking for systematic biases. For intersections with labelled cameras, she used image mosaics (see the examples below). For intersections without labelled cameras, she checked Google Street View.
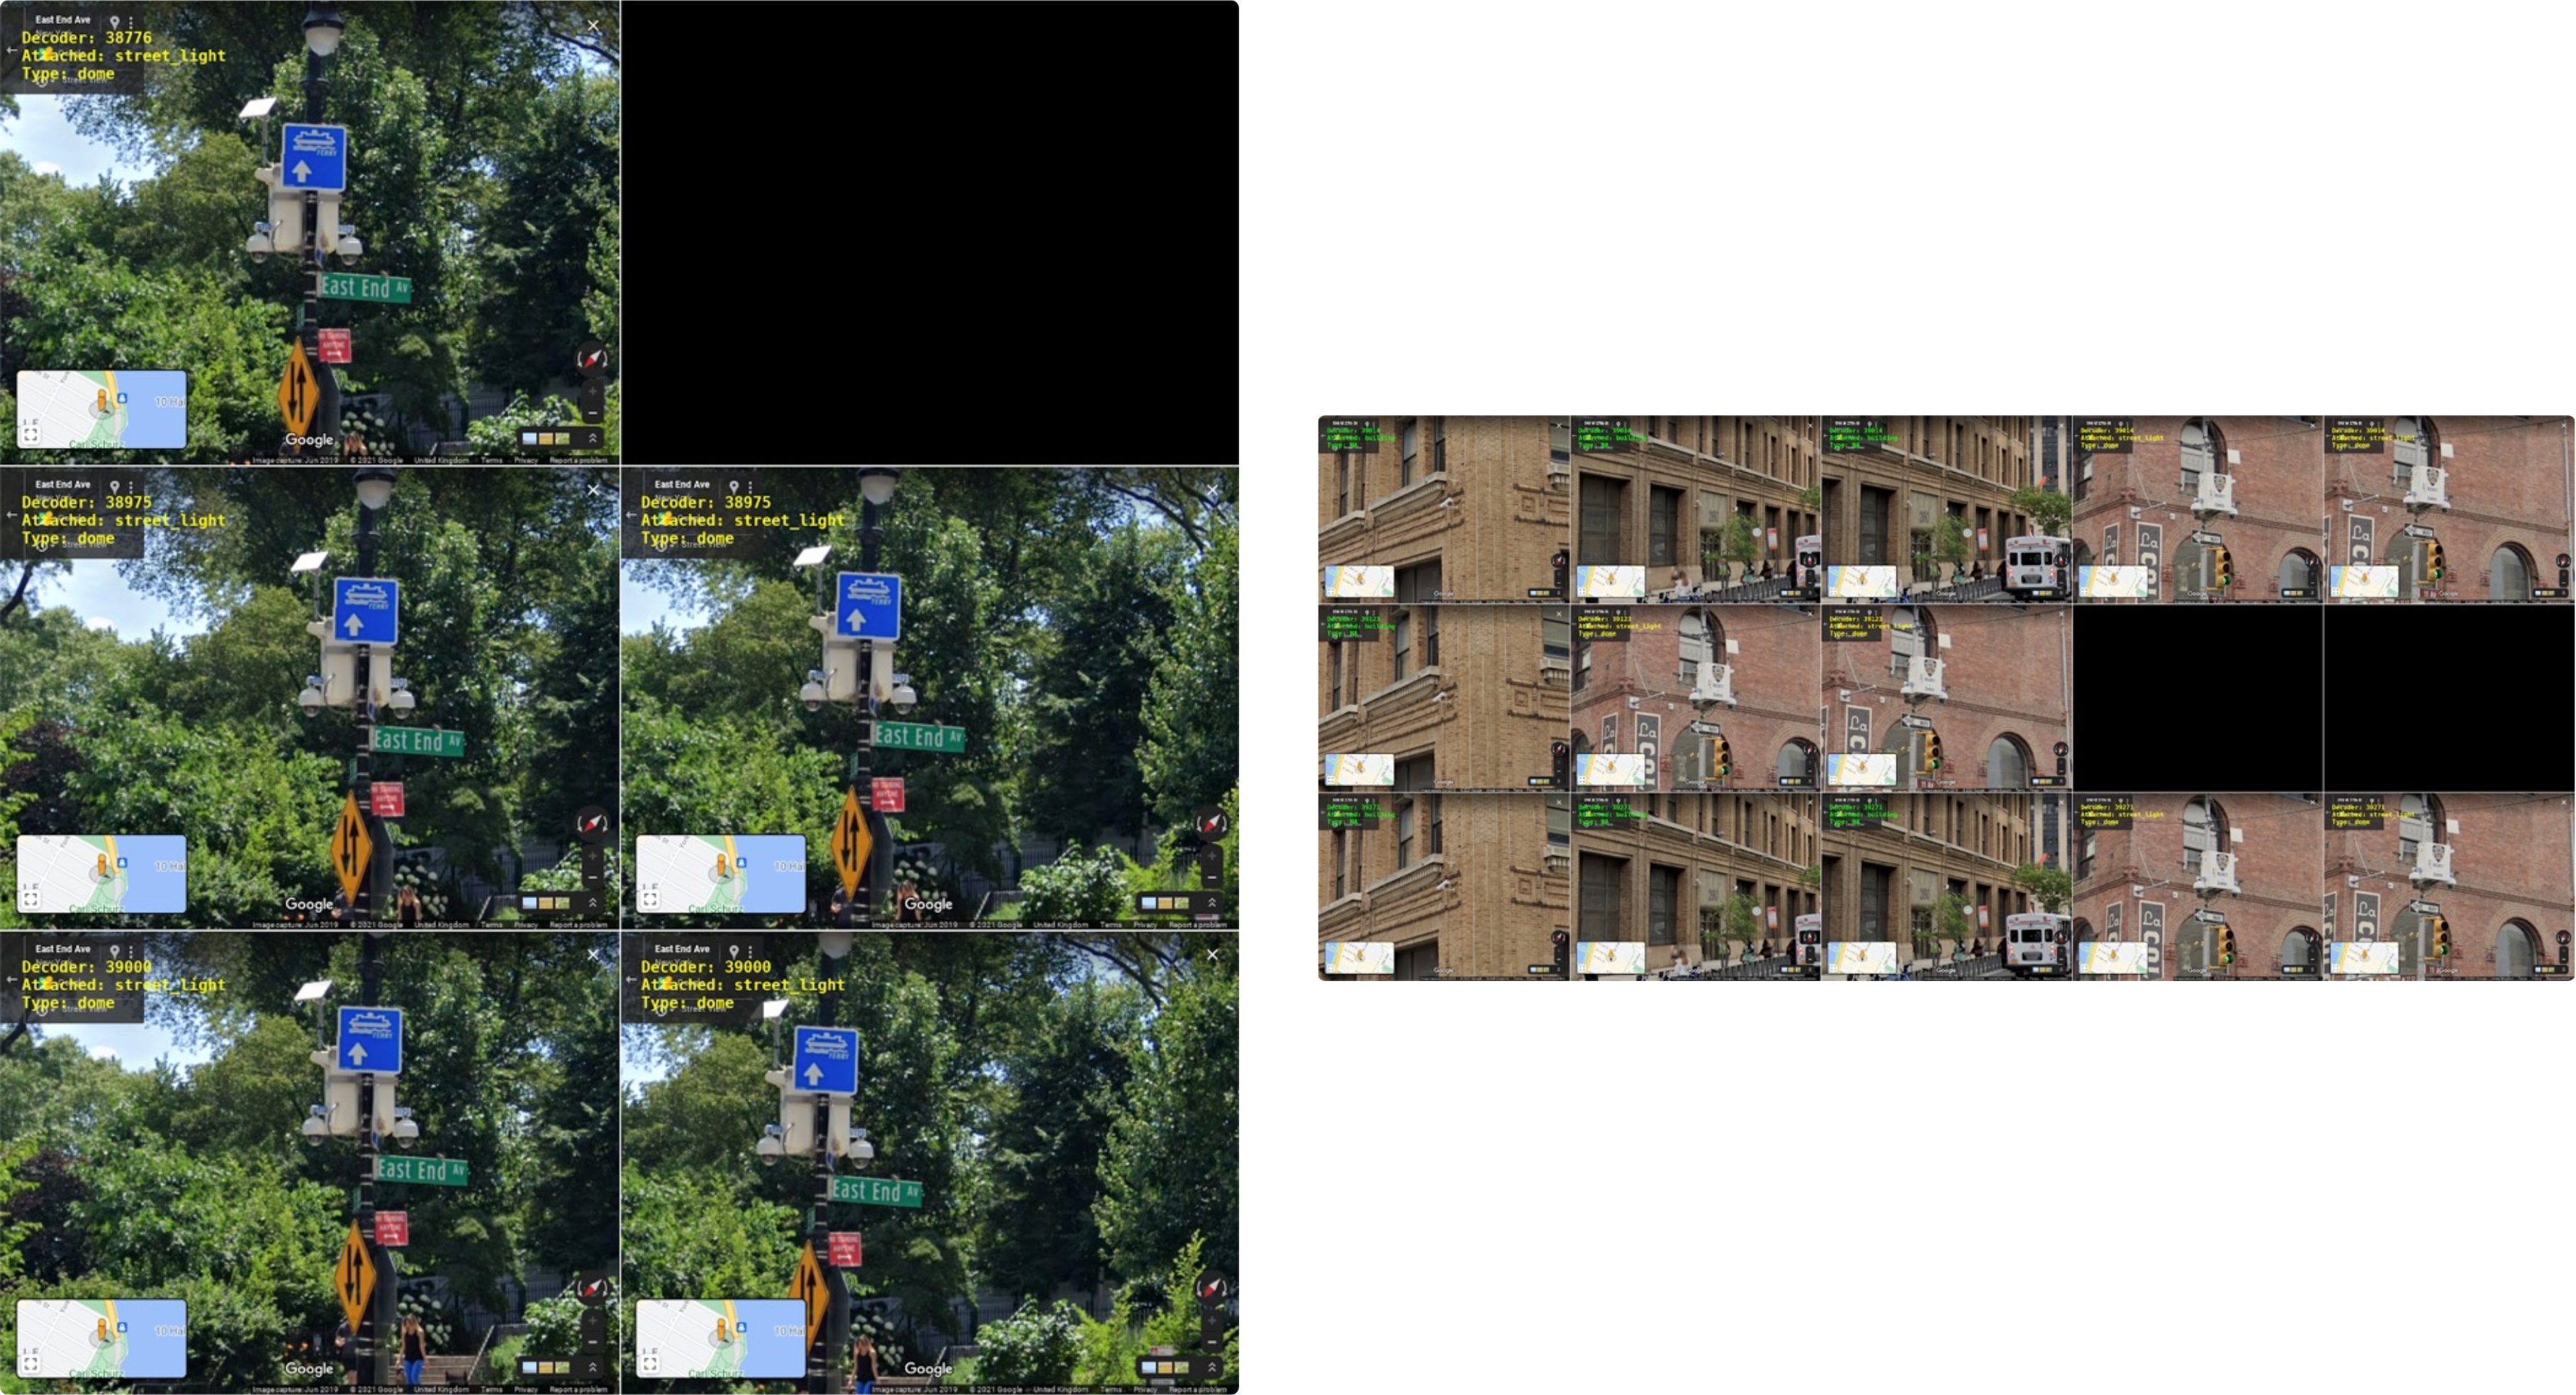
Image mosaics allowed researchers to manually review what volunteers had tagged and disagreement. Source: Amnesty International
Listed below are some of the common disagreements we uncovered:
- Decoders sometimes tag only one of the two cameras on NYPD Argus boxes — as visible for one decoder in the mosaics above. Volunteers will occasionally entirely miss NYPD boxes in full view. This could lead to undercounting public cameras.
- On roadside poles, decoders will sometimes tag non-camera objects such as other sensors, street lamps, and cell towers. This is more common for objects attached to roadside poles. If all three decoders at an intersection were to make the same mistake, this could lead to overcounting public cameras, but appears to be rarely the case — and the median mitigates all other cases.
- The boundary of the intersections is often disputed by volunteers, with some volunteers looking further down the street.
- Objects in low resolution, at a distance, and possibly magnified by the zoom function are more likely to be misidentified.
This qualitative insight into the disagreements affirmed three of our hypotheses:
- Data is never perfect: there will always be errors!
- Some disagreements err towards under-counting, some towards over-counting, with no glaring systematic bias jumping at the reviewer.
- The use of three decoders at each intersection is good mitigation against some of these individual errors.
Based on this qualitative review, we concluded that it was not unreasonable to consider that over- and under-counting were likely balancing out sufficiently for this first analysis.
Second, a quantitative review is ongoing. It aims to quantify how often and how far the decoders’ labels deviate from “the truth”, with quality indicators such as the probabilities of omission ( “1 – recall”), of false detection (“1 – precision”), etc.
In lieu of a physical ground truth of a perfect register of installed cameras, we are using counts from three experts, who have each labeled a common set of 100 intersections. These intersections were selected to represent multiple levels of decoders’ counts, using “importance sampling” to over-represent the worst cases. We then used a meta-expert (Sophie Dyer) to compare and uniformize the three experts’ labels. We are currently processing the results from this quantitative review.
Hidden steps
We spare the reader some of the more behind-the-scenes details. For example, most off-the-shelf statistical packages for classical reliability analysis assume all decoders viewed all intersections. Instead, since each intersection is only seen by three decoders, the decoder/intersection matrix is 99.9% sparse. While statistically valid, this required custom-made implementations, which the statistics team has resisted documenting at here.
Comparing across neighbourhoods of different sizes
We want to compare not just intersections, but areas of New York, such as Neighborhood Tabulation Areas (NTA), which are a type of administrative unit.

East New York in Brooklyn, an area that is 54.4% Black, 30% Hispanic and 8.4% White according to the latest census data, was found to be the most surveilled neighbourhood in all three boroughs, with an alarming 577 cameras found at intersections. Source: Amnesty International
However, NTAs are different sizes: the larger NTAs have more intersections and thus, mechanically, more chances to have more total cameras, without necessarily being more “surveilled”. To account for this (normalize) we must look at the density of cameras, i.e. the number of cameras per intersection: we divide the total camera count (obtained by summing the medians) by the number of intersections in each NTA. This accounts for the different NTA sizes, and is comparable across NTAs. This is the final number we map in the above choropleth.
Demonstrating field of view
To demonstrate the possible real world impact of our data, we estimated the maximum distance at which an NYPD camera could capture someone’s face at a resolution compatible with facial recognition software. To do this, we worked with architectural designer and investigator, Martyna Marciniak, to create a 3D site model of an NYPD Argus camera.
In the absence of tech specs for the NYPD Argus cameras, we researched commercial PTZ (Pan, Tilt, Zoom) cameras. We reviewed datasheets and demos such as this video and this advertisement.

A datasheet for the Uniview 4K Ultra-HD Network IR PTZ Dome Camera. Source: en.uniview.com
An analysis of historical Google Street View imagery told us that the camera we wanted to model (Argus_3) was installed between November 2017 and June 2018. With this knowledge, we based our model on a PTZ camera that was commercially available in 2017. The commercial camera had a varifocal lens of up to 134–148mm focal length, equivalent to 22× optical zoom, and 4K resolution. Its sensor size was approximately 1/1.8’’.
| Device ID | Object attached to | Device type | Cameras on device | Category | Government agency | Latitude | Longitude | Date first visible | Date not visible | Argus_1 | Street light | Dome or PTZ | 2 | NYPD camera | NYPD | 40.71827494 | -73.99388009 | Jul 2018 | Sep 2016 |
|---|---|---|---|---|---|---|---|---|---|
| Argus_2 | Street light | Dome or PTZ | 2 | NYPD camera | NYPD | 40.71784352 | -73.99304331 | Jul 2018 | Sep 2017 |
| Argus_3 | Street light | Dome or PTZ | 2 | NYPD camera | NYPD | 40.71775805 | -73.99228653 | Jun 2018 | Nov 2017 |
| Argus_4 | Street light | Dome or PTZ | 2 | NYPD camera | NYPD | 40.71608859 | -73.99600475 | Jun 2018 | Sep 2017 |
| Unknown_cam | Street light | Dome or PTZ | 4 | Unknown | Unknown | 40.72125878 | -73.98766728 | Jun 2019 | Nov 2017 |
| Traffic_1 | Street light | Dome or PTZ | 1 | Traffic camera | DOT | 40.71838037 | -73.99472515 | Aug 2013 | Aug 2012 |
| Traffic_2 | Traffic signal | Dome or PTZ | 1 | Traffic camera | DOT | 40.71739153 | -73.99154534 | Sep 2017 | Sep 2016 |
| Traffic_3 | Traffic signal | Dome or PTZ | 1 | Traffic camera | DOT | 40.7166947 | -73.98928746 | Jul 2016 | Aug 2014 |
| Traffic_4 | Traffic signal | Dome or PTZ | 1 | Traffic camera | DOT | 40.71907682 | -73.99046154 | Jul 2019 | Sep 2014 |
| Traffic_5 | Traffic signal | Dome or PTZ | 1 | Traffic camera | DOT | 40.71874364 | -73.98827103 | Jun 2019 | Jun 2018 |
| Traffic_6 | Traffic signal | Dome or PTZ | 1 | Traffic camera | DOT | 40.72046978 | -73.99417295 | Jun 2019 | Nov 2017 |
| Traffic_7 | Traffic signal | Dome or PTZ | 1 | Traffic camera | DOT | 40.72134501 | -73.98385017 | Jun 2014 | Aug 2013 |
Research spreadsheet showing publicly owned cameras, visible on Google Street View in the area covered by the site model. Source: Amnesty International
We found that currently the minimum resolution required by commercially available face recognition systems can be as little as approximately 24 px /face width.
| Specification | Our estimate | Methods and sources | Variables and assumptions | External source |
|---|---|---|---|---|
| Age of camera | 2017 – 2018 | Analysis of historical imagery on Google Street View | The camera was installed between mid-2017 and mid-2018. | Google Street View |
| Camera focal length and zoom | 134 – 148 mm focal length, equivalent to 22× optical zoom | Review of commercial cameras available in 2017 | Commercially available models are comparable to those that the NYPD had access to. The chosen model we selected is representative of PTZ cameras available in 2017. | UNV datasheet for 4KUltra-HD Network IR PTZ Dome Camera |
| Sensor size | Approx. 1/1.7″ | Review of commercial cameras available in 2017 | As above. | As above. |
| Image resolution | 4K | Review of commercial cameras available in 2017 | As above. | As above. |
| Minimum resolution required for FRT | 24 px – 40 px face width, under good conditions | Review of commercial FRT software available 2021 | Physical conditions, such as lighting, visibility. Technical specs, such as processing speed. | Kintronics IP Security Solutions, BreifCam, AXIS Communication |
| For camera modelled, maximum distance FRT possible | 24 px face width at 200 m | 3D modelling of site. | The reference imagery is accurate. | Open Street Maps, Google Street View, Google Earth |
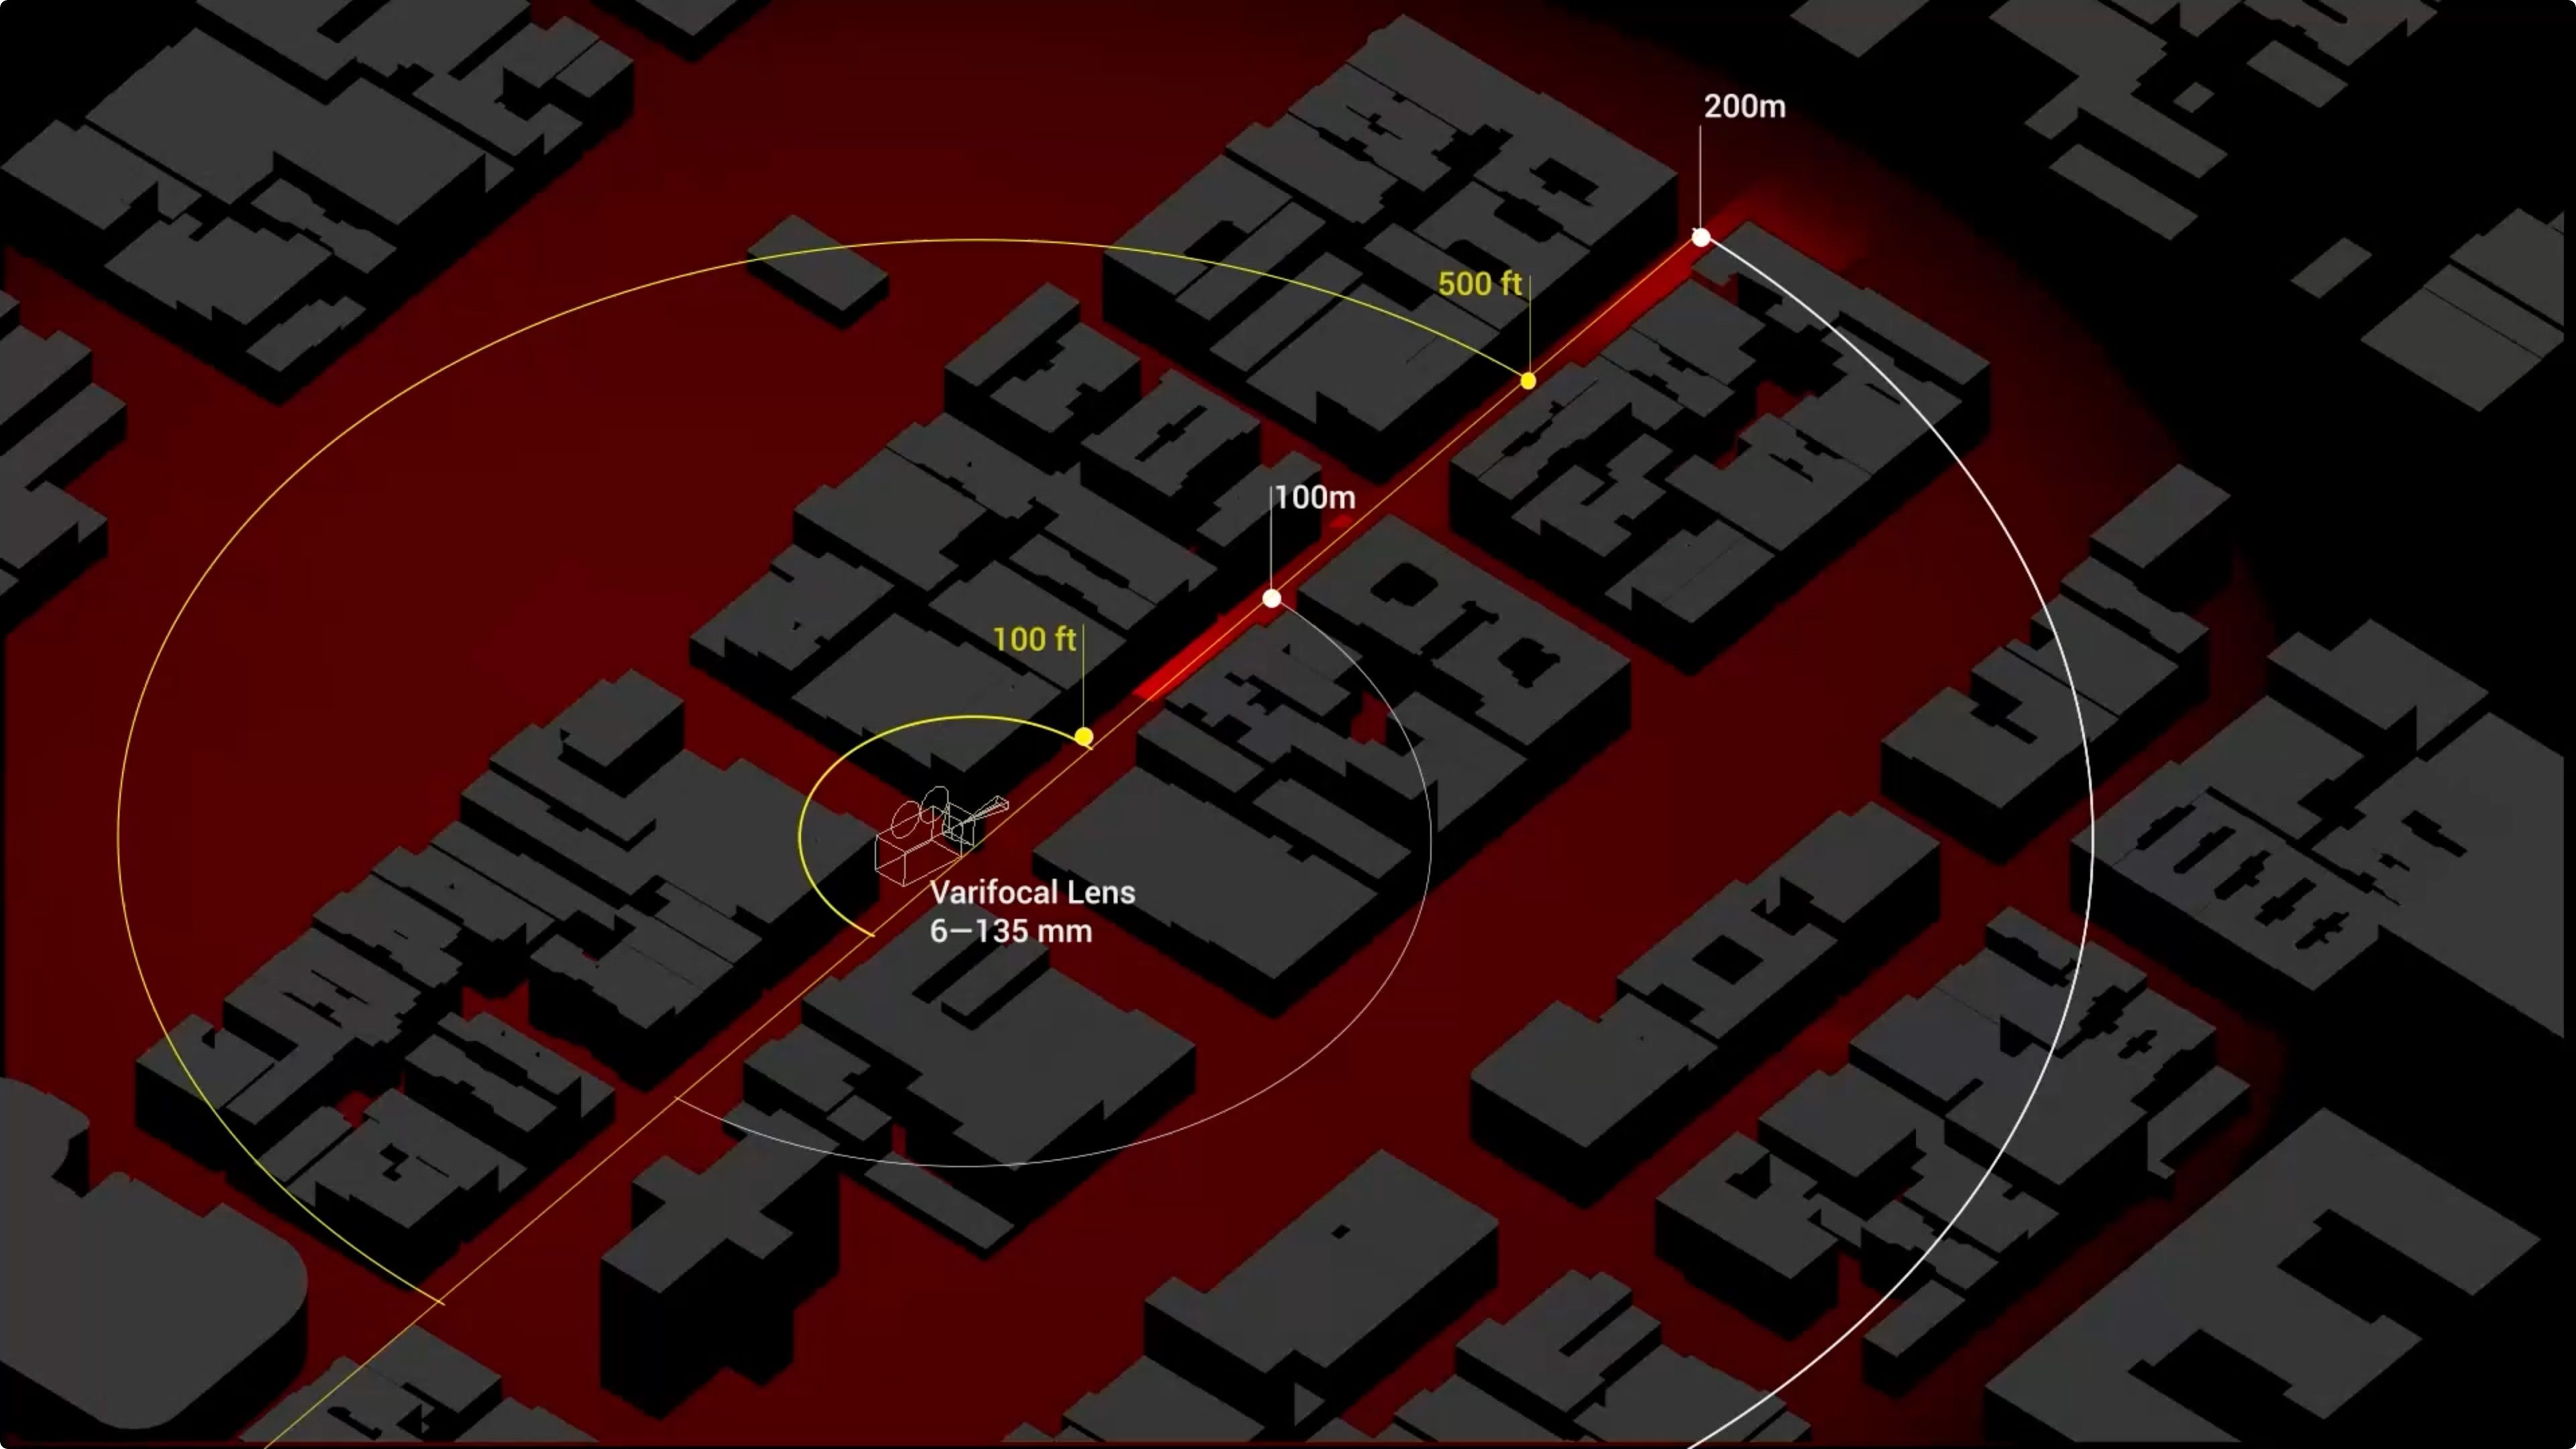
We then simulated the camera’s parameters in a 3D model of the site. For illustration only, we generated renders showing the possible resolution of a human face captured at different distances.
Caption: How far can an NYPD Argus camera see?
It is important to note that since we do not know the specifications of the NYPD cameras, seemingly minor changes in camera parameters can result in major changes to the field of view required for facial recognition. This is illustrated by the table below, where the 4K resolution in our chosen camera model has been replaced by HD resolution – resulting in the maximum distance necessary for a 24 px resolution to be reduced from 200 metres to only approximately 100 metres.
| Resolution of surveillance camera | Minimum face width in pixels required for FRT | Estimated maximum distance for FRT (measured from surveillance camera to a person’s face) |
|---|---|---|
| 4 K (3840 × 2160 px) | 24 px | 200 m |
| 4 K (3840 × 2160 px) | 40 px | 120 m |
| HD (1080 × 720 px) | 24 px | 100 m |
| HD (1080 × 720 px) | 40 px | 60 m |
Based on a camera model with a 1/1.7″ 12 MP sensor, we compared the resulting maximum distances for performing facial recognition based on differences in overall resolution and the required pixel/face width ratio.
There is also a notable difference in the quality of the commercial camera models between 2017 and 2021. For example the ‘oversized image sensor’ available in this “SCW The Spotlight 2.0” 2021 model offers a resolution three times greater, at 200 metres, than the 2017 model, as illustrated below, which means that newer cameras have an even greater facial recognition capacity.

Comparison of selected commercial camera models when the distance is 200 m and the camera’s focal length is 148 mm. Source: Amnesty International
To ensure our estimate of the camera’s field of view was as realistic as possible, we chose to model a real location that contained obstructions, such as buildings, trees, and street furniture. A site was chosen on the Lower East Side near the border of Chinatown and close to a known location in the Black Lives Matter protests that took place in 2019.
Site model at the intersection of Grand Street and Eldridge Street. Source: Amnesty International
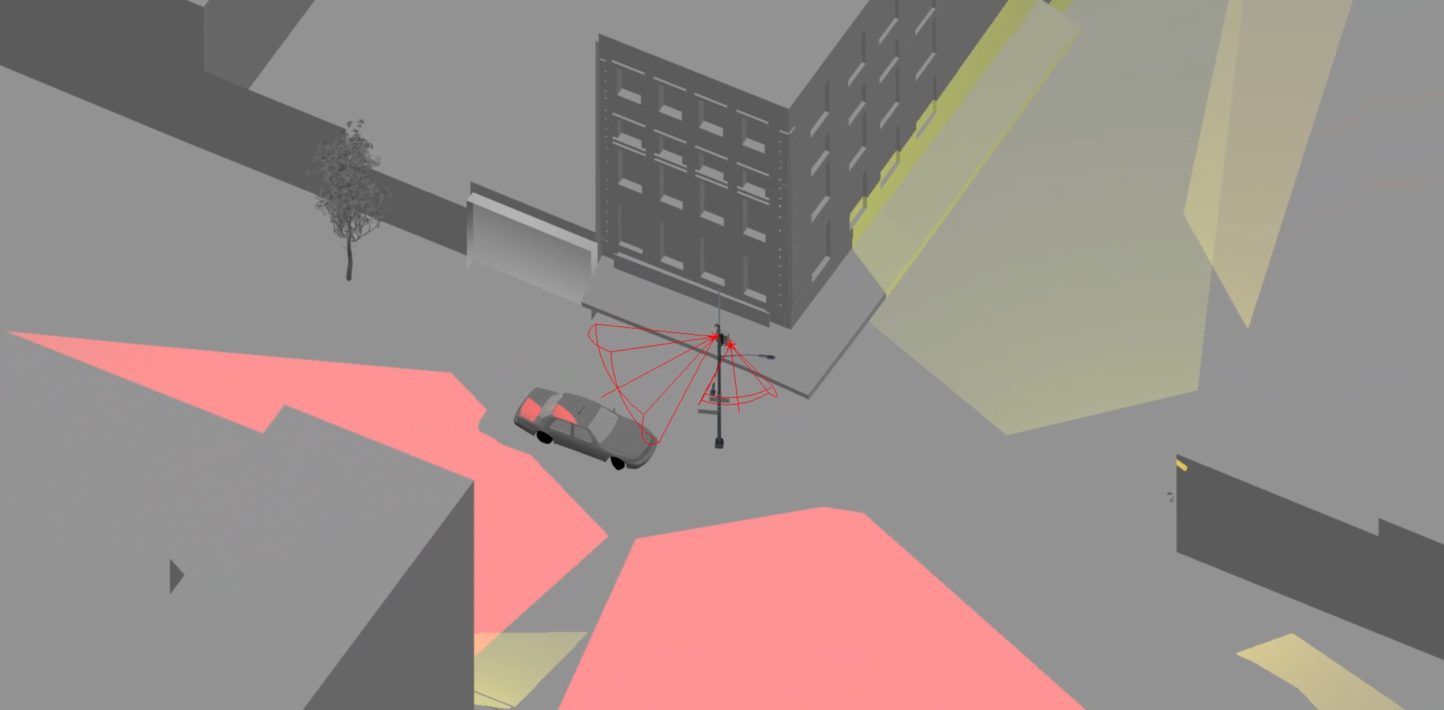
A plan view was used to show that a protester, walking to a protest site several blocks from an NYPD camera, still risked having their face captured, and so was unknowingly exposed to facial recognition.
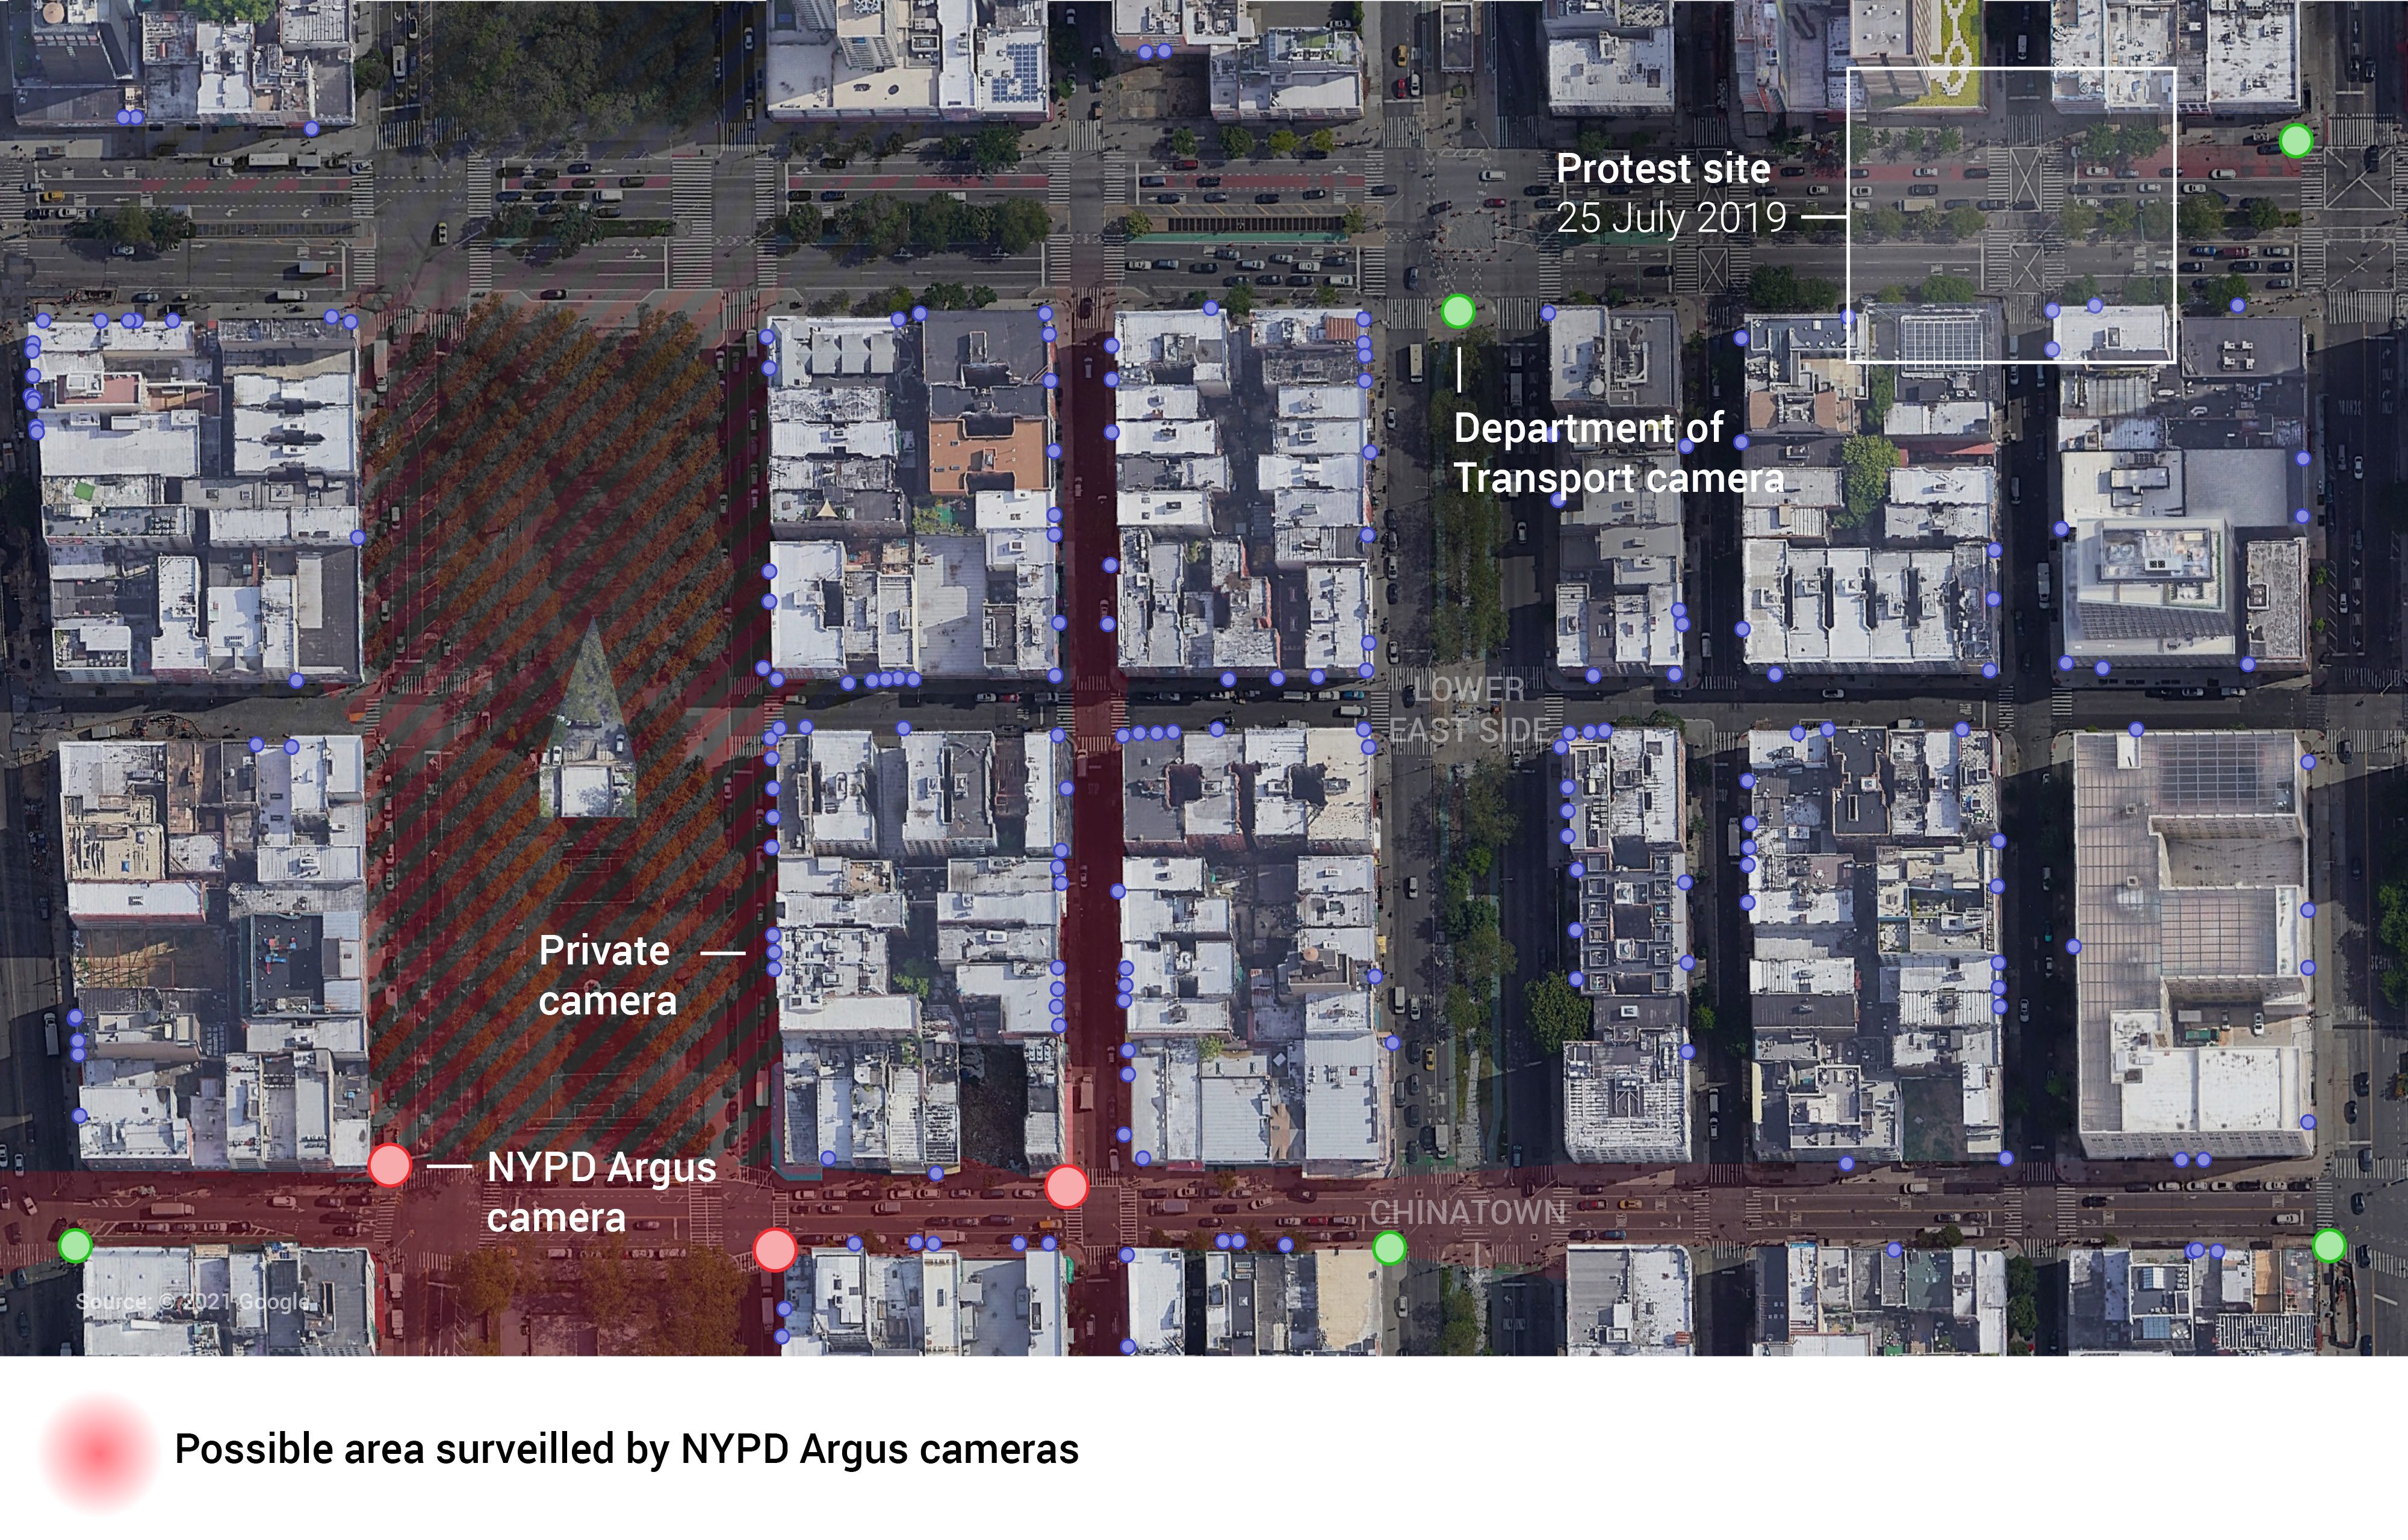
The possible area surveilled by three NYPD Argus cameras in the Lower East Side, close to the site of a Black Lives Matter protest. We also identified four traffic cameras owned by the New York City Department of Transport (DOT), and over 100 private cameras in the area.
The finding that an NYPD Argus camera had a possible field of view of up to 200 metres was applied to a heatmap created by Evidence Lab colleague, David Blood. Our intention was to allow people to explore the preliminary data but limit its resolution and disaggregation while we continue to evaluate its accuracy and reliability.
Next steps
We have already mentioned that the quantitative comparison to experts is ongoing. We investigated the use of reliability metrics such as Krippendorff recently published “Quadrilogy of Alphas” (2021). However, to ensure easy comparisons with common intuition points we are now focusing on more widespread metrics such as the aforementioned “precision and recall” on the presence/absence of cameras.
Some readers will have noticed the absence of any confidence intervals in this first analysis. The simplest way to compute them would have been Bootstrapping, but it does not play quite well with the median of three decoders. We are thus planning to look into Bayesian hierarchical modeling. The statistical refinements could be endless. We therefore have to cut at the right balance: numbers that can be trusted, but with methods that are standard and simple enough to be easily replicable.
We are also collaborating with an academic geographer and the New York-based civic organisation, BetaNYC, to do further analysis of the data with a focus on racial justice.