

The term ‘remote sensing’ refers to the collection of information whilst away from an object or place of interest. In this broad sense, the use of closed-circuit televisions (CCTV), drones, or even mobile phones may all constitute remote sensing. For the purposes of this blog, we will focus on space-based imaging, such as satellite imagery.
Major benefits of satellite imagery include that it can circumvent access barriers, show temporal and spatial patterns, scope areas of interest, and provide an accessible and reproducible form of human rights fact-finding. A recent rise in the number of satellites has dramatically increased publicly available satellite imagery, and platforms such as Google Earth Pro have made viewing the imagery more accessible, making it a common tool used in investigations.
This article builds on a session led by the Evidence Lab’s remote sensing analyst, Micah Farfour, during the 2022 Digital Verification Corps (DVC) Annual Summit in Mexico City. It offers a beginner’s guide to the terminology and skills needed to use satellite imagery to conduct preliminary analyses in areas of conflict or change.
In particular, you will learn the step-by-step basics of accessing satellite imagery through Sentinel Hub’s EO Browser, a user-friendly, educational platform that hosts freely available satellite imagery for browsing, visualisation, and analysis. The platform differs from Google Earth Pro in that you can use other spectral bands beyond those seen with the human eye (natural colour band combination), and the imagery is often more recently captured.
Basic terminology
Many of these concepts are also discussed here, but to review:
- Spatial resolution refers to the distance represented by a pixel in an image. Publicly available satellite imagery has spatial resolution as fine as 31cm. The smaller the distance, the more detailed the image. On the other hand, lower resolution images (e.g. 10m) are updated more frequently and have more coverage.
- Spectral resolution refers to the ‘bands’ of the electromagnetic spectrum measured by a sensor. Sensors are not limited to the visible spectrum, as seen below.
- Temporal resolution (or revisit time) refers to the time needed for a satellite to revisit the same observation area and capture another image.
It should be noted that remote sensing is rarely used in isolation in an investigation. For example, while satellite imagery can clearly visualise widespread fires, it does not show the cause. Conducting accompanying research on the seasonality of fires in the region, having ground photos, videos, or witness testimony of the event could all help a researcher better understand how the fire started and its true nature.
Sentinel Hub’s EO Browser
The EO Browser of Sentinel Hub is a fantastic educational tool for people who are new to remote sensing. It provides simple cloud access to many freely available remote sensing data collections. Basic features for exploring the data can be used for free, but extra features, tools, and datasets can also be purchased separately. Here is a brief overview of how we most commonly use the platform.
Different ‘data sources’ – for example, different sources of satellite imagery – have various attributes that can be used depending on the application. The two predominantly used for human rights research, accessed through EO Browser, are Sentinel-2 and Landsat 1-9:
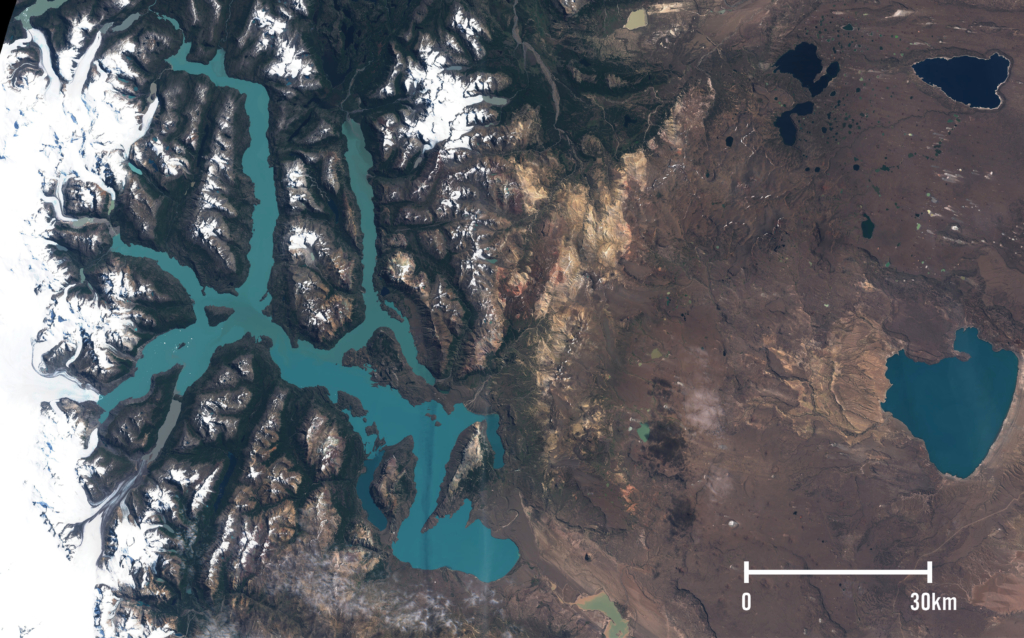
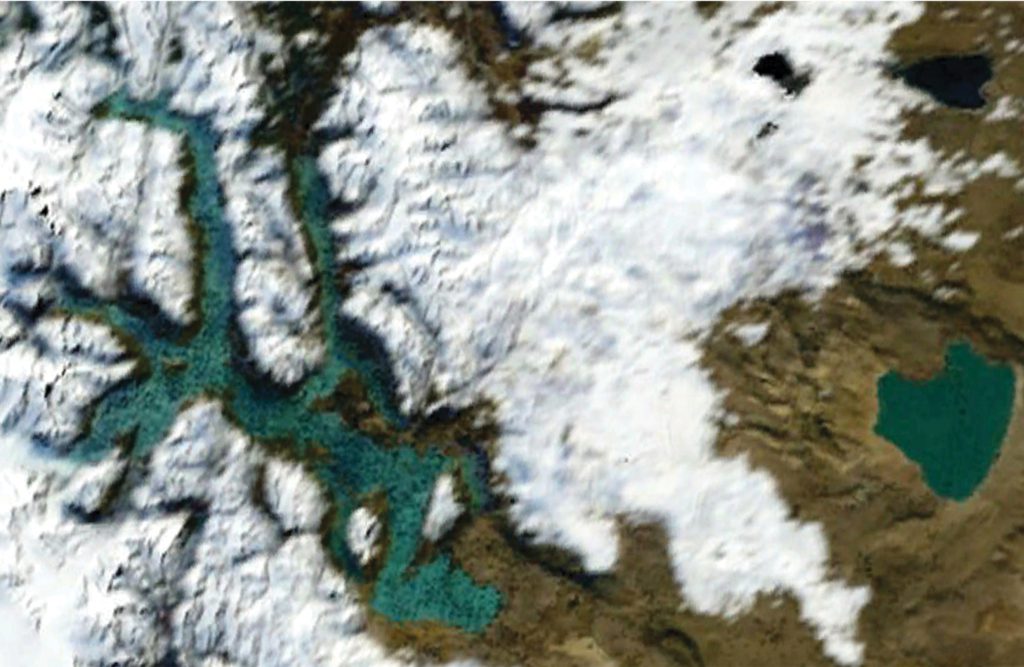
- Landsat 1 – 9 offer images of varying resolutions dating back to 1972. The historical library of the Landsat satellite images is key to climate research today.
- Sentinel-2 provides 10-metre resolution imagery dating back to 2015. It is the best resolution imagery freely available, and is immensely helpful in seeing large scale destruction, burning, or other changes.
| Landsat 1-9 | Sentinel-2 | |
| Operator | NASA | European Space Agency |
| Operation history | Since the 1970s | Since 2015 |
| Spectral Bands | 11 | 13 |
| Spatial resolution | 15-60m | Up to 10m |
| Temporal resolution | 16 days | 5 days |
The Evidence Lab most commonly uses Sentinel-2, so we will dive more into how to get the most out of this specific data source.
Sentinel-2 measures 13 bands in the electromagnetic spectrum, but there are only a few combinations that are commonly used in human rights investigations:
| Name | Electromagnetic Spectrum Band Combination | Description |
| “True color“ | 4, 3, 2 | Covers the visible spectrum at 10m spatial resolution. |
| “False color“ | 8, 4, 3 | Highlights the near infrared (NIR) band at 10m spatial resolution. The combination is useful for comparing healthy vegetation to unhealthy or burned vegetation. |
| Normalized Difference Vegetation Index or “NDVI“ | B8-B4 / B8+B4 | An index to measure vegetation health. Vibrant green represents healthy plants; white and light green represent less vegetation or cleared areas. |
| Short wave infrared or “SWIR” | 12, 8A, 4 | Can highlight areas with active fires or areas that have been recently burnt. Bright red represents active fires, while brown and dark colours represent burnt areas. |
Using EOBrowser to analyse Sentinel-2 imagery
First, you will need to sign up to the EO Browser for free. Once you have access, you can log in and start exploring. We will walk through a few locations and events that can be visualised with Sentinel-2 imagery.
Getting set up
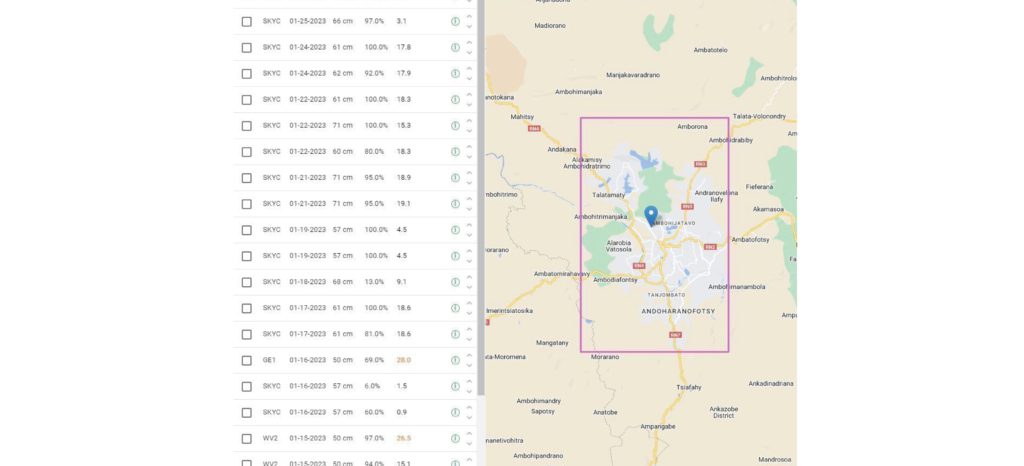
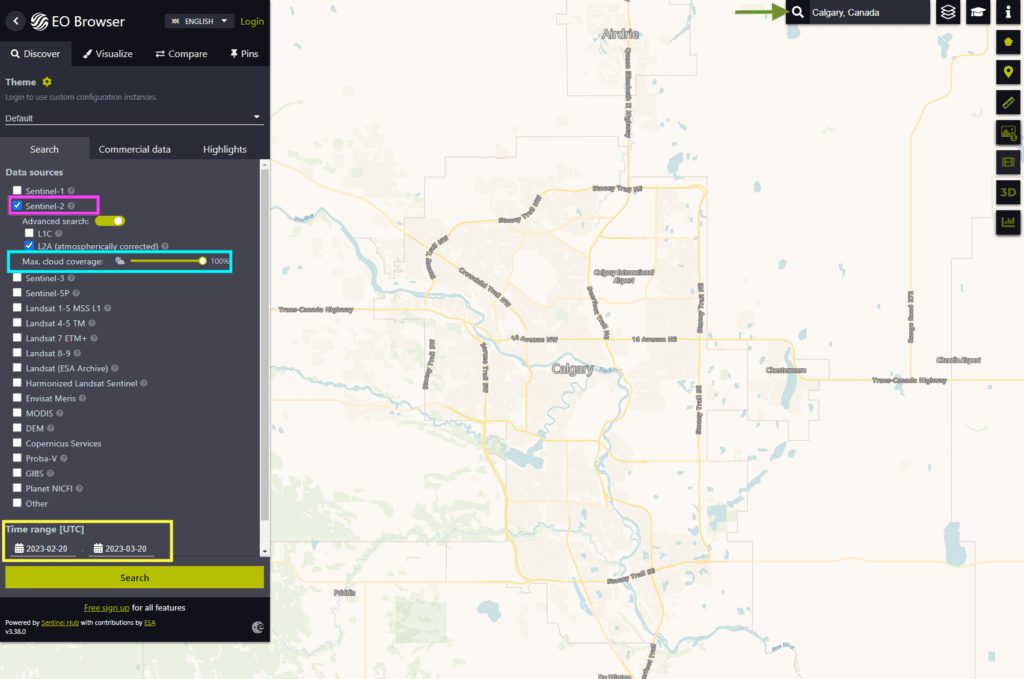
- Enter the location of interest as a place name or coordinates in the box on the top right of the screen. You may need to zoom in closer to focus on the specific location of interest. (green arrow in the image below)
- Make sure the Sentinel-2 box is checked. Turn on the ‘Advanced Search’ button if you would like to limit the amount of cloud cover in the resulting images. Also, the oldest imagery, from 2015, is only available as L1, so that will need to be turned on for the oldest Sentinel-2 imagery. (pink and blue boxes in the image below)
- Set the timeframe needed to capture the event. (yellow box in image below)
- Click ‘Search‘.
Exploring band combinations
Now, let’s explore some locations and see how powerful the different band combinations can be:
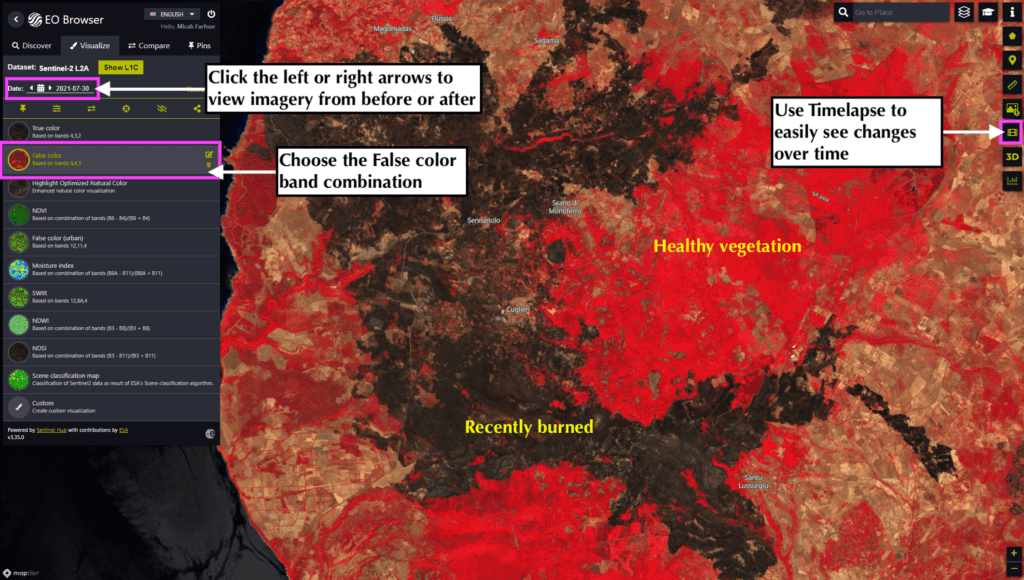
1. Go to 40.187, 8.5645. Narrow the timeframe to 1 – 31 July 2021, click ‘Search’, pick a clear image to ‘Visualize’, then select the ‘false-color’ band combination. Here we used an image from 30 July.
- The massive forest fires in the Montiferru area in Italy in late July 2021 can be observed, as indicated by the large visible black patches.
- The ‘false color’ combination highlights the near infrared band, which is especially good at showing healthy and unhealthy or burned vegetation.
- You can compare the image in ‘true color’ by clicking on the band combination above it.
- You can also look at imagery before and after by clicking the arrows by the date or using the TimeLapse tool on the right. This will reveal the fires that burned vegetation here between 22-25 July 2021. First responders can quickly use this information to know where the fires are moving, and which villages need to be assisted.
- Besides fires, ‘false color’ can also visualise large explosions and missile strikes if they impact the surrounding environment. Sometimes it can even suggest the firing position of the strikes. For example, in November 2020, artillery was fired into Tigray from Eritrea. This was quickly discovered because the surrounding vegetation was burnt by propellent from the gun.
2. Go to 47.4394, 34.6586 between 1 May – 30 September 2022 and use the NDVI Index. Here, we created a timelapse to best highlight the changes:
- The health of the crops can easily be visualised over time.
- The areas where the fields go from green to white are likely due to harvesting.
3. Go to 35.9499, 39.0105 between 1 June – 31 October 2017 and use SWIR band combination. Pick the image from 15 October 2017.
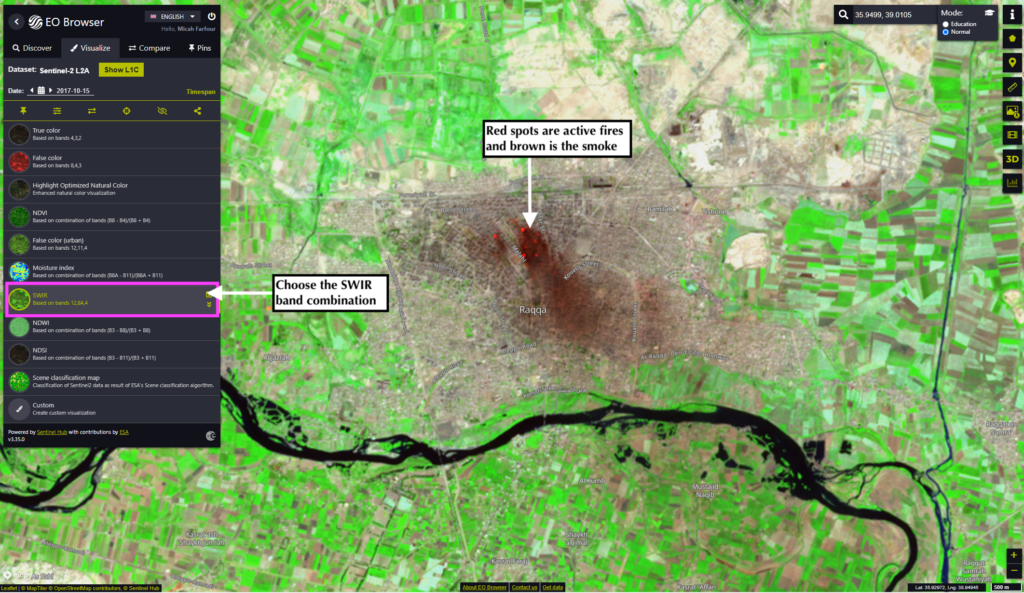
- The red spots show active fires, and the brown is the dark smoke from the continuous bombing of Raqqa, Syria by U.S. military forces. Moving through time or creating a timelapse, you may even be able to see the destruction of the buildings in the city, as much of it was reduced to rubble.
- This can be used alongside other band combinations, like natural color, to better determine major areas of destruction over time.
Your turn
Check out the news for an interesting location or just check out your hometown to see how things have changed over time. Test all the different band combinations and discover which one works the best. As you work through your location, bear in mind:
- What points of interest can be observed in the images?
- What conclusions can (or cannot) be drawn from these observations?
- What issues may be raised which may warrant further investigation through other methods?
This blogpost documents a training run by Micah Farfour, Special Advisor for Remote Sensing in the Evidence Lab at Amnesty International, during our 2022 DVC Summit. The annual DVC Summit was held at Universidad Iberoamericana, Mexico City from 19-21 September 2022.