

In the Evidence Lab within Amnesty International’s Crisis Response Programme, we often need to use maps both to present the findings of our research and as an exploratory tool to help geolocate audio-visual material. These uses could include plotting geospatial data on a map in order to visualize its geographic distribution, for example, or exploring satellite imagery to match geographical features to those appearing in video footage.
While these tasks can often be accomplished offline using desktop software such as QGIS or ArcGIS, it is sometimes necessary to have a web-based solution to enable fast, easy sharing of maps among the team or to include interactive maps as part of the findings we publish through press releases or reports. This is where tools such as those offered by Mapbox become extremely useful.
Mapbox GL JS is a JavaScript library for rendering interactive maps on the web. Maps can be designed using the online Mapbox Studio application, then made available for either preview or publication on Mapbox’s servers or incorporated into web pages using Mapbox GL JS. Mapbox tools are popular for web mapping due to their flexibility and extensive documentation. Mapbox also offers a free pricing tier that enables users to start making and publishing maps at no cost.
In this post, I’ll explore two examples of the ways in which we have used Mapbox tools in our work in the Evidence Lab. They have proved useful in both the research and presentation phases of a varied range of projects.
Interactive maps for exploration
A recent new feature of Mapbox GL JS, added in version 2, is the ability to render maps with 3D terrain. This was previously a somewhat involved process that required the use of Mapbox’s digital elevation model (DEM) layer and the JavaScript WebGL library three.js. Now, maps with 3D terrain and high-quality satellite imagery can be created in Mapbox Studio and published directly to the web, even without coding.
While other tools exist for exploring terrain in 3D, such as Google Earth Pro — popular for use in geolocation tasks — Mapbox Studio makes it easy to create and share 3D terrain maps of an exact location with a specific camera view without requiring the installation of desktop software or the exchange of geospatial data files. A web browser is all that is needed to view and explore them on any device.
This recently proved useful in our investigation, with CNN, of the massacre of a group of men by Ethiopian soldiers in the state of Tigray, Ethiopia. Videos showing the killings taking place on a dusty, rock-strewn ridge above a valley with sparse vegetation appeared online in early March, but required extensive verification. By creating a map with 3D terrain in Mapbox Studio and sharing it among the team — taking only a few minutes — we were able to explore the specific area and match and cross-check patterns in the vegetation to those appearing in the video.
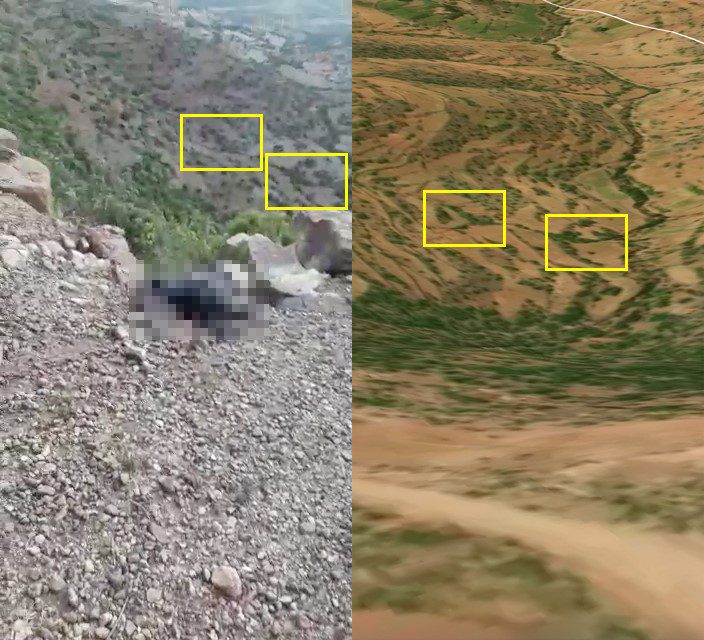
The complexity of the geography did require further analysis, as we explain in this post, but being able to explore the terrain in Mapbox facilitated the initial geolocation steps, allowing our team to hone in on and explore initial areas of interest.
Interactive maps for presentation
Mapbox GL JS offers a range of functionality for presenting geospatial data, including the ability to add basic data layers such as points, lines and polygons to maps in Mapbox Studio, as well as more advanced code-based features such as custom WebGL layers and camera controls. While other tools such as Google Maps or Leaflet offer similar feature sets, map customization can often be accomplished with less code using Mapbox GL JS.
A common Evidence Lab use case for maps is to show the geographic distribution of points, usually representing events involving possible human rights violations. An issue with plotting large numbers of points, however — particularly at country level — is that they often overlap and form messy clumps, muddying the information the map is intended to convey.
Mapbox GL JS provides a solution to this in the form of clustering. When the cluster option is set on a point data source, Mapbox GL JS will automatically group points together into an appropriately positioned cluster at lower zoom levels. Clusters can be styled — resized, for example, or coloured — according to the number of points they “contain”. As the user zooms in, the clusters subdivide until they have completely dispersed into their constituent points, which can be made to display a popup with additional information on click.
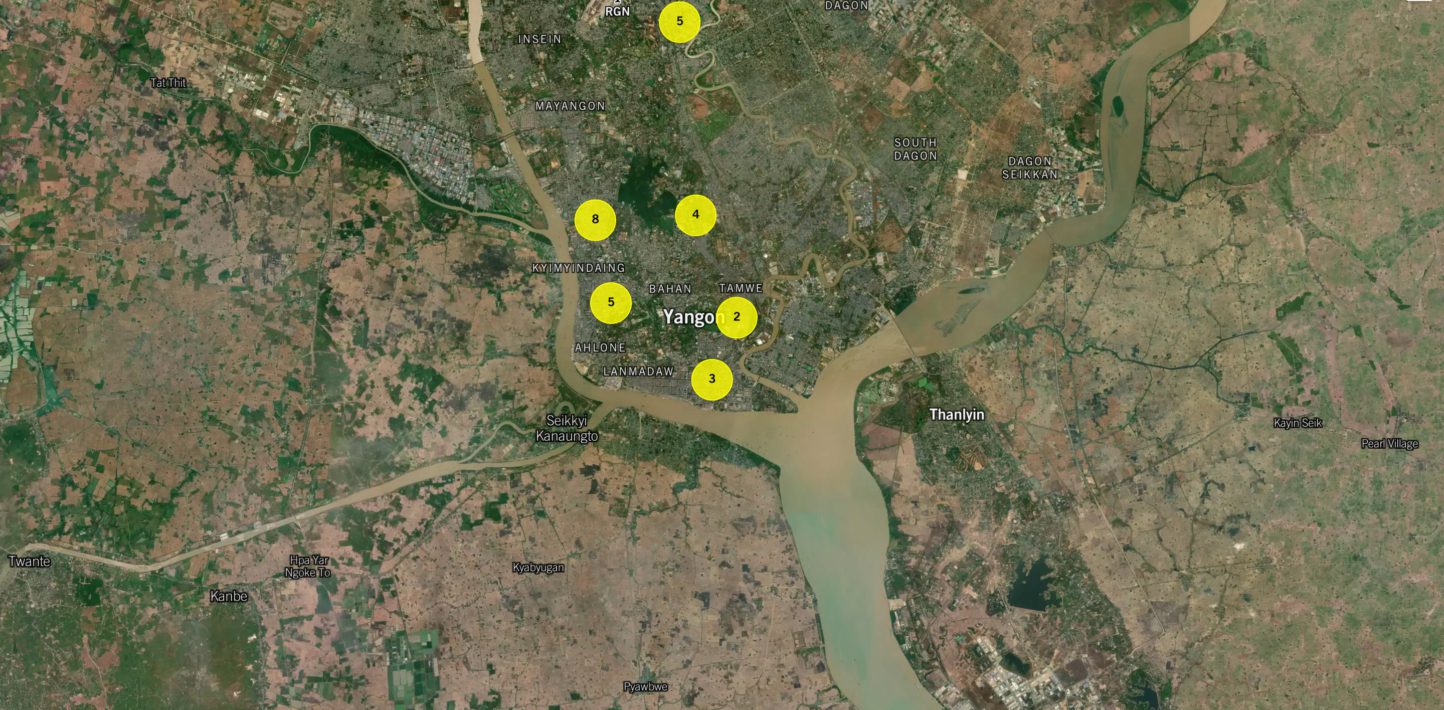
Clustering is an intuitive way to vary the level of detail shown at different zoom levels when plotting points on a map. This was useful when we wanted to map the locations of the recent excessive use of force, including lethal force, against protesters in Myanmar. This map was created as a component in a simple React app, the code for which we have made available on GitHub.
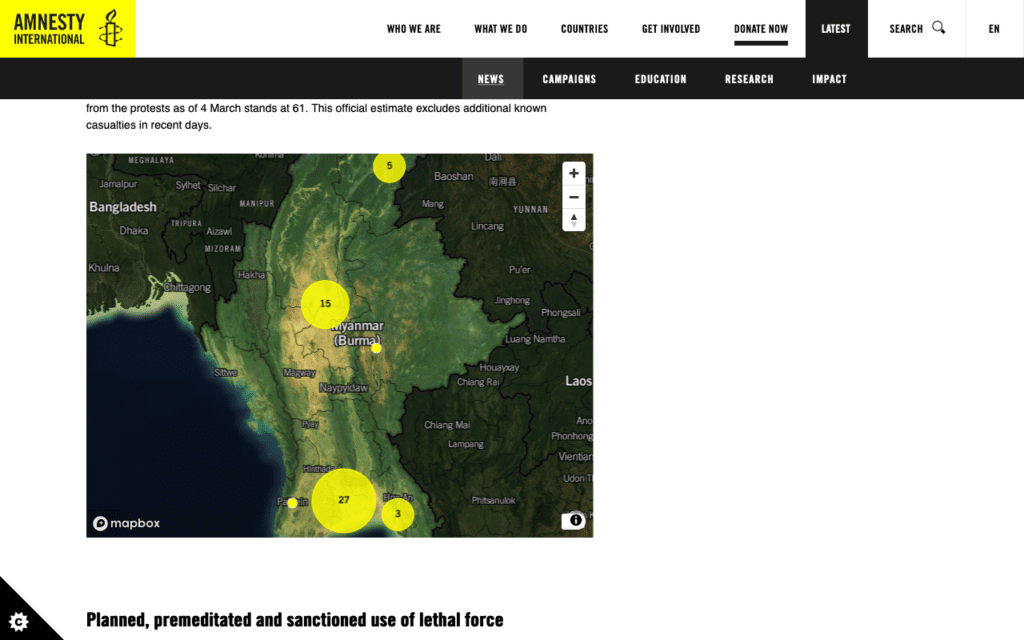
To make Myanmar stand out among neighbouring countries at lower zoom levels, we added Mapbox’s country boundaries layer to the map, filtered out Myanmar, then styled the layer in such a way that all other countries have a slightly transparent black fill.
The combination of Mapbox Studio and Mapbox GL JS can add substantial value in human rights research and communications. We look forward to seeing how these tools continue to evolve and to finding new uses for them in our work.